
When it comes to finding a mate or defending a territory, animals need to recognise members of their own species. The reasons are intuitive: you only want to mate with your own species to ensure viable offspring, and you should only invest the effort in being territorial when confronted by rivals from your own species. There are exceptions and these are interesting—hybridization or territorial competition between species—but generally animals need a system for species recognition.
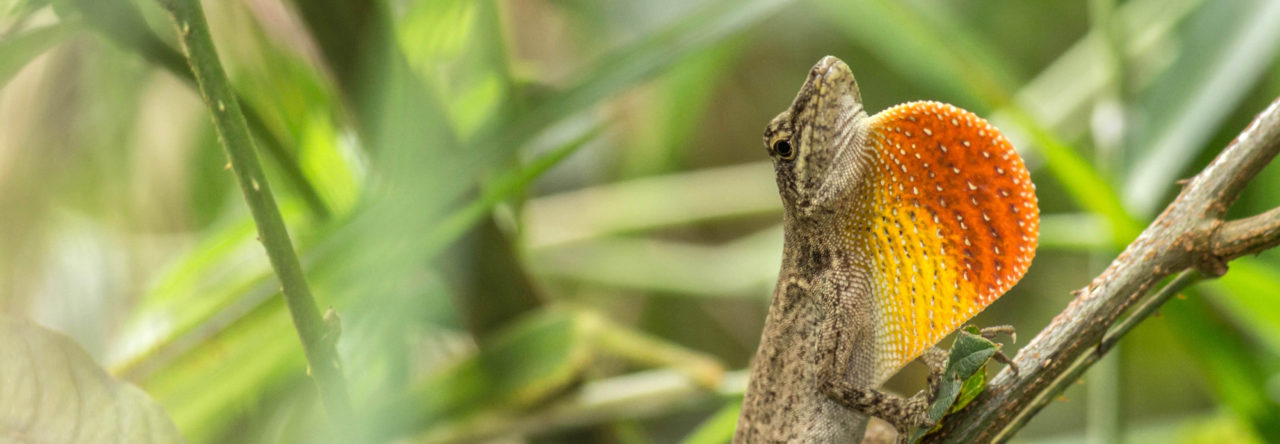
The large, often spectacularly coloured throat fan or dewlap of anoles seems like an obvious way to evaluate species identity. Taxonomists have historically thought so, too. Each species appears to display a dewlap that’s unique in colour and pattern. But there are various Anole Annals posts highlighting this is not always the case. Instead, the colour of the dewlap is often an adaptation to the light environment for enhancing the detection of territorial displays.
So what about those territorial displays? Might anoles use the complex movements of the head-bob and push-up display to figure out species identity?
Classic work by Charles Carpenter and Tom Jenssen revealed how often the head-bob movements of lizards, and anoles in particular, seemed specific to each species. Pioneering experiments using video playback by Joe Macedonia in the ’90s has also provided evidence that anoles are able to distinguish displaying rivals of their own species from those of other species. But what is it about the pattern of movements used in the head-bob and push-up display, or even how the dewlap is extended and retracted, that conveys species identity? Is there one feature that varies the most among species that anoles commonly rely on to identify species?

Display-Action-Pattern graphs (above) showing the complexity of movements used by Puerto Rican anoles for territorial advertisement displays
These are hard questions to answer. Anole displays are complex, using many different types of movements, so there’s a huge number of possibilities. One approach would be to isolate and manipulate each type of movement and use video or robot playbacks to ask the anoles themselves. But doing that would take an entire career. There are a seemingly infinite number of combinations to consider. In fact, it would be impossible without a way to narrow things down.
Claire Nelson is a creative (and courageous!) graduate student who had an eye for solving the challenge. She figured it was possible to leverage the large archive of footage I’d accumulated over many, many years. These videos were of free-living male lizards performing territorial advertisement displays. Her idea was to develop an objective method for identifying which movements used in the head-bob, push-up or dewlap display had the potential to convey species identity. She’s just published her solution in Animal Behaviour.

Claire (above) doing a balancing act with some non-anoles
Claire used this archive of display videos to create Display-Action-Pattern graphs, a method developed by Carpenter back in the 60s. These track the up-and-down movement of head-bobs and push-ups as well as the extensions and retractions of the dewlap during the territorial display. To keep it manageable, she limited her efforts to anole species on Puerto Rico, and graphs of about 10 territorial advertisement displays per male. But there was an important biological reason for selecting this number of displays as well. It effectively mimicked the number of displays an anole might typically see on first encountering another lizard. That is, anoles likely make judgements on species identity from only a handful of displays.
From these Display-Action-Pattern graphs, Claire took a host of measures, ranging from the duration and number of movements used, to variation in amplitude and pauses between movements. She also noticed that anoles tend to perform certain combinations of movements together in what she came to call ‘motifs.’ After many many hours of effort, Claire accumulated a huge amount of data for nearly 20 different types of display movement for eight Puerto Rican Anolis species, and in many cases, for different populations of the same species.
Claire asked me for advice on how to analyse it all. I have to admit I was completely useless on this front. I muddled something about using coefficients of variation and some other nonsense, but really I had no idea. I was still in shock over how much data she had accumulated, and the novelty (and implications) of discovering motifs in the displays. She knew what she was doing, though. Her analytical solution was vastly superior to anything I could have suggested.
Claire investigated a variety of approaches, but in the end she settled on the method of random forest tree classification. It’s a sophisticated machine learning algorithm that, in a nutshell, takes data and groups like with like. It doesn’t require any prior direction or preconceived notion on how data should be grouped. It just uses the variation in the data itself. You could view the algorithm as an anole brain using basic rules of variation to make judgements on which displays are likely to be different and which displays are likely to be the same.
The outcome was impressive. The algorithm correctly assigned the vast majority of lizards to their correct species based on just a handful of displays. Where errors occurred, it was partly because lizards were assigned to the right species, but the wrong population. This means anoles from different populations tend to share some display features because they’re still from the same species. Yet the algorithm was able to correctly assign most lizards to the right population. In other words, there was still enough variation in the displays between populations of the same species to identify them as belonging to separate populations. This is very interesting!

Random forest tree classification (above) can assign over two thirds of displaying lizards to their correct species.
The evolution of new species begins with individuals of the same species starting to segregate from each other in some way. Often it’s physical separation (on opposite sides of a mountain range), but changes in social signals can also prompt behavioral separation as well. This could be the case for some anoles on Puerto Rico. Once individuals stop recognising each other as the same species, they no longer reproduce with one another, and the door to speciation is propped open.
The other discovery Claire made was the apparent lack of any common display feature that could be used to identify species (and population identity). Instead, different features were important for different species. The duration and number of headbob movements were features that could be used to identify the territorial displays of Anolis poncensis—a species that is striking in its use of lots of extremely rapid, up and down body movements—whereas the way the dewlap was extended was influential in identifying different populations of Anolis gundlachi—a species that has an unusually long dewlap display. Other species like Anolis pulchellus and Anolis krugi were best identified by effectively considering features of the entire territorial display.
Whether or not anoles actually use the features identified by the algorithm in species recognition remains an open question. But Claire has managed to identify the potential candidate cues that could be used. It is now possible to develop a focussed research program to test whether, and how, anoles used these features to identify species. Again, the obvious way to do this would be to ask the lizards themselves using robot playbacks.
Random forest tree classification sounds awfully complicated, and it is very sophisticated, but it’s actually easy to implement. Any dummy can do it. I taught myself how and wrote a step-by-step tutorial so you can as well. We’ve published this tutorial alongside Claire’s paper in Animal Behaviour. Give it a whirl!

- Want to Know More about Animal Behaviour, in Spanish? - April 27, 2026
- What Grenadian Anoles Revealed about How Animals Establish Territories - March 13, 2026
- Want to Know More about Anole Behaviour? - January 29, 2026
Jon Richfield
My salute and admiration to a very promising young woman and to the author for his support. May both of you go from strength to strength.
This work recalls the quip: “Ginger Rogers did everything that Fred Astaire could — backwards, and in high heels”. I always am particularly appreciative of the achievements of women in science, engineering, medicine etc, because most of them have to work in a more challenging professional environment than a man in the same field.
Claire certainly seems to have the necessary talent and commitment for what it takes.
And the work is not only interesting in itself, but looks like fertile ground for insightful development.
Terry Ord
PostScript to post:
Joe Macedonia has reminded me that there are other ways of identifying potential identity cues in lizard displays, which I didn’t mention in the blog post above and I’m not sure made it into Claire’s paper either (it happens, and sincere apologies to Joe, Dave Clarke and Morgan Fonley).
Here’s a belated correction:
In a 2019 paper in Herpetologica, Joe and his team introduced the use of the Discrete Fourier Transform (DFT) to measure and classify the bobbing displays of four Galápagos lava lizard species. They used 13 variables to characterise each display, then used PCA to get a smaller set of uncorrelated, normally-distributed variables, and finally used DFA (and pDFA) to classify the displays to species. They had 24 displays from 12 males of each species — again a reasonable approximation of lizards needing to make quick decisions on species identity from only a handful of displays. The DFA did a respectable job at correctly classifying 73-81% of displays to species.
In a more recent paper appearing in a 2021 issue of Herpetological Monographs, Joe’s team expanded the approach to the ‘grahami’ anoles from Jamaica and Grand Cayman. They again used the DFT approach, but also used the traditional Carpenter/Jenssen ‘unit’ analysis method to determine if one approach (or the combination of approaches) was better at classifying displays to species and, for three species, to subspecies/population. They found the variables most successful in determining classification success depended on the particular analysis. Some analyses were extremely successful (e.g., DFA classification success of displays from the three Anolis grahami subspecies/populations ranged roughly from 94-100%), whereas classification success for most of the other taxa ranged from about 69-94%.
Do check these two great papers out:
Macedonia et al. 2019. Herpetologica 75: 290-300 [https://doi.org/10.1655/Herpetologica-D-19-00015.1]
Macedonia et al. 2021. Herpetological Monographs 35: 65-89 [https://doi.org/10.1655/HERPMONOGRAPHS-D-20-00007]
Gianna Coppola
It is so amazing how these small lizards are able to recognize all of these patterns! Anoles continue to fascinate me the more I read about them.