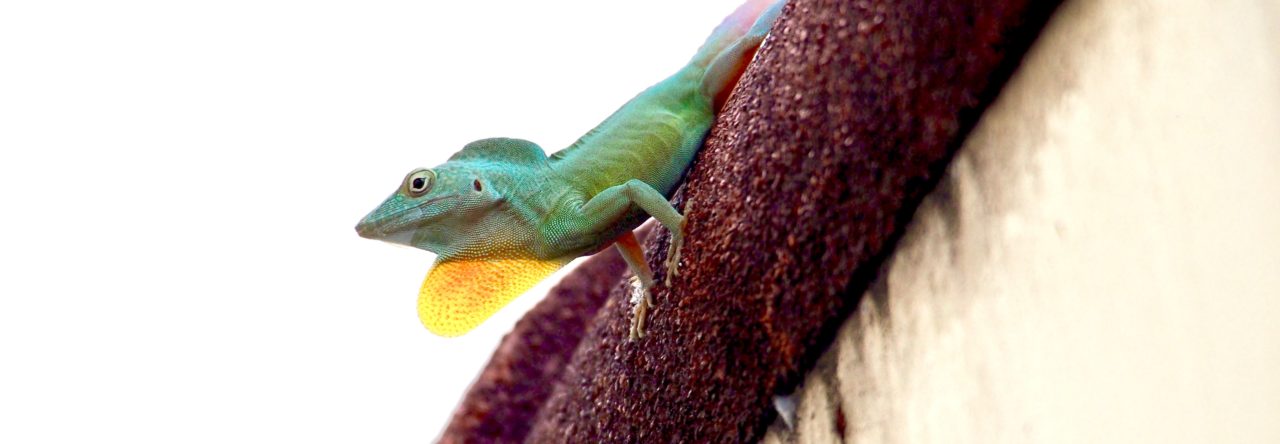
Category: Explainers

Do Anoles Display with Greater Complexity than English?

Above: the territorial display of a male Anolis stratulus on Puerto Rico

Take the time to watch the displays of an anole and you might appreciate how elaborate those signals seem to be. And by comparison to other lizard species, the anole display is arguably one of the most complex. Not only do anoles communicate with the up/down movement of head-bobs, but with the repeated extension of a large dewlap that in itself is often spectacularly colored. These displays are used to convey a variety of messages, from advertising the ownership of territories to the attraction of mates. We know the display is packed full of detail on species identity too.

But how do we go from gut impressions of what is complex to properly measuring the complexity of lizard displays, or any form of animal communication for that matter, including human language? The main way scientists have done this is by essentially counting the number of different components and using that to estimate an animal’s communication repertoire. There are various problems with this, such as deciding which components are different enough to count. It’s the most common method probably because it’s the easiest, but it is also the crudest. It offers only a basic view of signal complexity, missing the complexity inherent within components making up the repertoire.

An alternative approach is to apply some math from physics to measure the information potential of a signal. It is better than simply counting things because it measures the complexity of the entire signal, including the number of different components and the elaborations within those individual components as well. Best of all, it doesn’t require any decisions on what parts of a signal might be worth counting. It also provides a common, repeatable index of complexity that can be used to compare signals from very different animals, such as anole displays and human language.

So, how do anole displays stack up?

Want to know whether Anolis pulchellus on Puerto Rico has the most complex display? Read the paper and find out!

First, let’s consider some other lizards. The head-bob displays of sagebrush lizards (Sceloporus graciosus) are fairly representative of other species of fence lizards, and they clock in at 4.26 bits of information per display. “Bits” is a general unit for the amount of ‘information’ (think data) that can be “potentially” encoded in a signal, or its “information potential” for short. The number is largely meaningless by itself. The songs of birds would probably be the most obvious rivals of complexity in nature. Chickadees have 4.64 to 5.79 bits per song. But is that effectively the same or way more complex than sagebrush lizards? We need more benchmarking.

How about the famous waggle dance of the honeybee? The waggle dance was first uncovered by Karl von Frisch who found that it was a highly accurate signal conveying the direction and distance to an outside nectar source to worker bees inside the hive (google it, it really is super interesting). This discovery later contributed to von Frisch winning the Nobel Price alongside Konrad Lorenz and Nikko Tinbergen. von Frisch was also one of the first scientists to apply information theory to animal communication. The honeybee waggle dance comes in at 7.43 bits per dance. Bees are more complex than birds!

If we apply the same method of measuring complexity to written English, we find it has about 8.12 bits per word. Now let’s recap: sagebrush lizards are 4.26 bits per headbob display, chickadees are 4.64-5.79 bits per song, the honeybee waggle dance (my personal favourite) is 7.43 bits per dance, and written English is about 8.12 bits per word. Those comparisons in themselves are very interesting, but what about anole displays?

We’ve comprehensively measured the male territorial displays of eight different species of Puerto Rican anole and published our findings in Behavioral EcologyWhen I say comprehensive, I mean just that: we measured dewlap colour pattern, the way in which the dewlap is repeatedly extended and retracted during the display, the pattern of movement of both push-ups and head-bobs, and a variety of other behaviors often seen accompanying territorial displays (e.g., tail curls and flicks).

The least complex part of the display is the dewlap colour pattern. At best, it encodes 1.02 bits per dewlap pattern. That’s for a dewlap with at least four different colours. The movement of the dewlap during the display—the timing of the in/out movement, how much the dewlap is extended—has far more information potential with as much as 3.87 bits per display. The sequence of head-bobs is the most complex aspect of the anole display and can be as high as 5.11 bits per display. Considering the entire display, the complexity of the territorial display ranges from 6.54 bits per display in Anolis poncensis to a whopping 15.40 bits per display in Anolis pulchellus.

15.40 bits per display! Does this mean anole displays are more complex than written English? Yes! And no. The estimate for written English—8.12 bits per word—was for single words, not a sentence, a paragraph or an encyclopedia. But the fact that anole displays are as complex as they are and might outclass songbirds is truly amazing.

It is contentious as well. During peer-review of our paper, some scientific referees found the reported values hard to digest. All of them thought our numbers for anoles were correct, but couldn’t accept that signals of mere lizards might be more complex than those of songbirds. The comparison to written English drew so much heat that we had to remove comparison to it from the paper entirely. The referees had various reasonable points. One referee highlighted that the value for written English was for single words, not whole texts (fair enough). Another referee suggested our application of information theory was more comprehensive than how it has been previously applied. The implication being other studies have tended to focus on measuring the easiest things and not the full breadth of a song (hmm…).

If you want to find out which Puerto Rican anole species varied most in display complexity and the adaptive explanations of why, or what might have driven the evolution of such complex signals in anoles to begin with, you’ll have to read our paper. Email me and I’ll send you a free copy.

Anoles outclass songbirds? Why not, I say. Perhaps in communicative complexity, but certainly on many other scales.

Clouded Anoles: How Islands Affect Morphology

Ecogeographical rules attempt to simplify ecological and evolutionary processes that shape morphology. In a cool study published this summer in Current Zoology, Anaya-Meraz and Escobedo-Galván (2020) examine the combined effect of Rensch’s Rule and van Valen’s Island Rule in Clouded Anoles. Specifically:

Rensch’s Rule: within lineages, sexual dimorphism decreases in magnitude with increased body size when females are the larger sex but increases in magnitude when males are the larger sex.

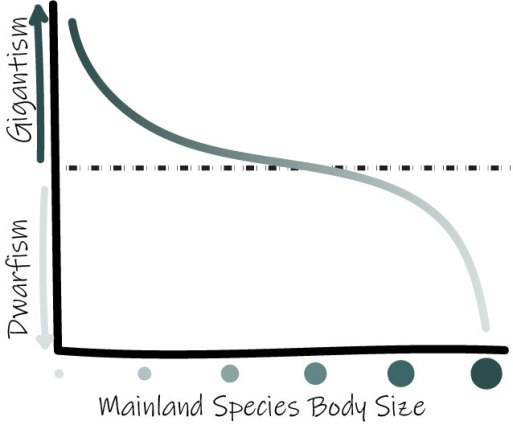
The center black line indicates 1:1 male to female size, the top line and bottom lines indicate male- and female-biased size dimorphism, respectively. *Adapted from Piross et al. 2019.

van Valen’s Island Rule: describes the tendency of diminutive and large mainland species to trend toward gigantism or dwarfism on islands, respectively, due to competitive factors.

*Adapted from Lomolino, 2005

In their paper, Anaya-Meraz and Escobedo-Galván ask, how does Clouded Anole (Anolis nebulosus) sexual size dimorphism change when the Island Rule could be in effect?

Using 305 Clouded Anole museum specimens, they found that sexual size dimorphism differs between the mainland and island populations. While all populations revealed variation in the degree of sexual size dimorphism, populations on the Islas Tres Marías uniformly possess male-body size bias. But on the mainland, 40% of the populations had the opposite pattern, female-body size bias.

Intriguingly, Anaya-Meraz and Escobedo-Galván note that in the Clouded Anole, island males spend almost 50% more of their waking period engaged in some form of social interaction (Siliceo-Cantero et al. 2016). This is offered as an explanation for why male Clouded Anoles also have larger dewlaps among the Tres Marías populations.

In lizards, the Island Rule may not necessarily stand out as a trend (Meiri, 2007), but we see from Anaya-Meraz and Escobedo-Galván’s study that male Clouded Anoles are larger on islands. On the Antillean Islands, the magnitude of sexual size and shape dimorphism of anoles decreases with increased anole species diversity (Butler et al., 2007). The Islas Tres Marías populations follow this pattern in having increased sexual size dimorphism when not competing with other anole species.

*Adapted from Poe et al. 2017.

Overall, Clouded Anole body and dewlap sizes are larger in insular populations while Rensch’s Rule does not show a clean pattern in this species. However, as noted by the authors, it is important to consider the adaptive force of being on an island versus the ancestral condition. To truly understand morphological evolution within a species and across the genus we need to know body size trends of closely related species. Moreover, some researchers are discouraging studies that determine the universality of ecogeographical rules in favor of integrative approaches based around hypothesis testing (Lomolino et al. 2006, Lokatis & Jeschke, 2018).

What do you think? Is there room for using ecogeographical rules within an integrative framework (See Benítez-López et al. 2020)? Or do ecogeographical rules obscure true drivers of adaptation?

References:

Anaya-Meraz, Z. A., and A. H. Escobedo-Galván. 2020. Insular effect on sexual size dimorphism in the Clouded Anole Anolis nebulosus: when Rensch meets Van Valen. Current Zoology, doi: 10.1093/cz/zoaa034.

Benítez-López, A., L. Santini, J. Gallego-Zamorano, B. Milá, P. Walkden, M. A. J. Huijbregts, and J. A. Tobias. 2020. The island rule explains consistent patterns of body size evolution across terrestrial vertebrates. bioRxiv 2020.05.25.114835. Cold Spring Harbor Laboratory.

Butler, M. A., S. A. Sawyer, and J. B. Losos. 2007. Sexual dimorphism and adaptive radiation in Anolis lizards. Nature 447:202–205. Nature Publishing Group.

Lokatis, S., and J. M. Jeschke. 2018. The island rule: an assessment of biases and research trends. Journal of Biogeography 45:289–303. Wiley Online Library.

Lomolino, M. V. 2005. Body size evolution in insular vertebrates: generality of the island rule. Journal of Biogeography 32:1683–1699.

Lomolino, M. V., D. F. Sax, B. R. Riddle, and J. H. Brown. 2006. The island rule and a research agenda for studying ecogeographical patterns. Journal of Biogeography 33:1503–1510.

Meiri, S. 2007. Size evolution in island lizards. Global Ecology and Biogeography, 16:702-708.

Poe, S., A. Nieto-montes de Oca, O. Torres-Carvajal, K. De Queiroz, J. A. Velasco, B. Truett, L. N. Gray, M. J. Ryan, G. Köhler, F. Ayala-Varela, and I. Latella. 2017. A Phylogenetic, Biogeographic, and Taxonomic study of all Extant Species of Anolis (Squamata; Iguanidae). Systematic Biology 66:663–697.

Piross, I. S., A. Harnos, and L. Rózsa. 2019. Rensch’s rule in avian lice: contradictory allometric trends for sexual size dimorphism. Scientific Reports 9:7908. Nature Publishing Group.

Siliceo-Cantero, H. H., A. García, R. G. Reynolds, G. Pacheco, and B. C, Lister. 2016). Dimorphism and divergence in island and mainland Anoles. Biological Journal of the Linnean Society, 118:852–872.

This post was originally published on biomh.wordpress.com.

Speciation: How One Species Becomes Two

Speciation is the process by which one species evolves to form two or more new species. Often members of different species are unable to interbreed due to the evolution of reproductive isolating barriers. Exactly how to define a species is a matter of active debate among biologists, but most agree that a species is an interconnected population of organisms that have an evolutionary trajectory independent from other species. This independence is critical to the evolution and maintenance of biological diversity. Populations evolve new traits by way of natural selection, where traits that are adaptive (beneficial to the survival or reproductive output of individuals bearing them) are favored and become more common in a population. However, whether a trait is beneficial or not depends on the species it arises in. For example, while conspicuous coloration in a poisonous frog is beneficial, the same trait would be disastrous for harmless species. If all frogs were a single species this trait would be quickly purged from the population. Reproductive boundaries, formed by the process of speciation, provide a mechanism for species to evolve independently from one and another, and accumulate distinctively adaptive traits.

“Sister species” are pairs of species more closely related to one another than to any other species. Anolis krugi (left) and Anolis pulchellus (right) are sister species of grass-bush anole native to Puerto Rico. Photos by Day’s Edge Productions.

The study of speciation boils down to asking the question “where do species come from?” While speciation is a fundamental part of evolution, our knowledge of exactly how the process of speciation works is surprisingly incomplete. For many years the prevailing theory of speciation focused on isolation. In this model, populations of a single species are physically separated from one and other. This could be due to the formation of some impenetrable barrier, like a mountain or glacier, or due to dispersal, like arriving on a remote island. Once isolated, these populations evolve independent from one another, and given enough time, they will randomly accumulate enough differences to be considered distinct species. The spectacularly blue-dewlapped Anolis conspersus from Grand Cayman island is one likely example of speciation by isolation. This species’ closest relative is Anolis grahami from Jamaica. The ancestors of present-day A. conspersus arrived on Grand Cayman from Jamaica thousands or millions of generations ago and formed a new population. Over, time the Jamaican and Caymanian populations accumulated differences in isolation such that they now considered distinct species. 

The beautiful Anolis conspersus from Grand Cayman is most closely related to Anolis grahami of Jamaica. Photo by Anthony Geneva

Scientists often observe that a species and its closest relative differ in their ecology. These sister species may occupy different habitats or different structural parts of their environment. This pattern is not predicted by the isolation theory and this observation gave rise to an alternative theory of speciation where adaptation plays a central role. The theory of ecological speciation posits that speciation occurs as a side-effort of populations of a single species adapting to different habitats or environments. Adaptive evolution can proceed very rapidly, especially compared to the random accumulation of differences in the isolation theory. While there is evidence for both speciation by isolation and ecological speciation we don’t know which (or if either) are responsible for most of the species diversity on earth.  

Anoles are a great group to study speciation for a number of reasons. First, there are over 400 species of anole, so they are clearly adept at speciating. Second, many anole species appear to be in the process of speciation, for example Anolis distichus populations in Hispaniola are partially reproductively isolated from one and other. Finally third, anoles are particularly well suited to investigate which theory of speciation best fits what we see in nature. Thanks to many decades of evolutionary and functional ecology research, we have a strong grasp on what anole traits are ecologically adaptive. With this knowledge, we can use anoles to test the relative importance of isolation time and adaptive evolution in driving the process of speciation. 

Ecological differences may accelerate the speciation process. Anolis cooki and Anolis cristatellus are two Puerto Rican species that are closely related but occupy very different habitats.[/caption]

Anole Invaders

The current distribution of plants and animals around the Earth has been strongly influenced by colonization, the ability of organisms to disperse short or long distances on their way to establishing new populations. Over the past several hundred years, humans have increased the rate and distance over which organisms colonize new lands. These human-mediated introductions have reshaped basic patterns of biogeography, a field that investigates the geographical distribution of plants and animals. Some of these invaders cause ecological or economic harm in their new homes and are known as invasive species. In cases where we lack detailed study of an introduced species, we often use high local abundance and rapid spread as proxies for invasiveness. Anoles are one of the most prolific groups of invaders with over 20 different species introduced outside of their native ranges. Most anole invaders originate from Caribbean islands and introductions occur to other islands in the Caribbean, Atlantic and Pacific as well as South Florida, Central America and Southeast Asia. Researchers are studying a diverse array of topics related to anole invasions including the origin of invaders in their native ranges, patterns of introduction and spread, and impacts on native species.

The brown or festive anole (Anolis sagrei) is native to Cuba and the Bahamas, but has been introduced widely around the Caribbean, Central America, and the continental U.S., where it has spread north from the Florida Keys into several other states. Photo by Day’s Edge Productions.

In my lab, we use DNA sequences and other types of genetic data to identify the origin of introduced anoles. Where did invaders originate from in their native range? How many introductions have occurred? How have they spread in their introduced range? You can think of each anole that invades a new area as having their native-range origin encoded in their DNA as if they were carrying a passport from their home region. Using this approach on over a dozen anole species, we in most cases identified the geographic source of introductions, commonly hubs of transport and commerce, which is consistent with anoles being transported by shipping. Many of these anole introductions occurred among Caribbean islands or from Caribbean islands to South Florida. We also found that anole invasions often originate from multiple, geographically and genetically distinct populations in their native range and when thrust together in their introduced range they mix together. This has important implications for evolution, including the potential to enhance adaptation by increasing genetic variation. Our DNA studies also reveal that well-established populations in introduced range can become sources for secondary introductions, which has been termed the bridgehead effect. Brown anoles (Anolis sagrei) are a particularly good example of this phenomenon as introduced populations in South Florida around Miami are likely the source of introductions to Bermuda, Grand Cayman, Grenada, and Hawaii. Similarly, the spread of green anoles (Anolis carolinensis) in the Pacific resulted from a stepping-stone pattern among islands after introduction to the region.

The green anole (Anolis carolinensis) is native in the southeastern U.S., where it competes with the invasive brown anole (Anolis sagrei). Elsewhere in the world, the green anoles have been introduced and are themselves the invaders! Photo by Day’s Edge Productions.

Islands have played a special role in illustrating some fundamental patterns of biogeography, including the well-supported observation that smaller and more remote islands harbor fewer species. However, human-mediated dispersal has increased the occurrence of long-distance and over-water dispersal, which were relatively rare prior to human travel on the sea and in the air. Recent studies of anoles on Caribbean islands show that humans have reduced geographic isolation among islands and economic activities now strongly influence patterns of anole biogeography. Islands also provide excellent arenas for experimental investigation of the consequences of anole invasions for native species. After invasive brown anoles arrived on small islands off the Florida coast, native green anoles shifted their habitat use to higher perches, presumably to reduce competition with lower-perching brown anoles. Within a mere 20 generations, green anoles adapted to their more arboreal circumstances by evolving larger toepads, which should allow them to cling better to the more risky higher perches. This is one of the best examples of rapid evolution caused by competition between an invader and a native species. Researchers are interested in studying anole invasions to gain insight both into basic ecological and evolutionary processes, such as species interactions and adaptation, and to mitigate the negative ecological and economic impacts caused by invasive anoles.

Powered by WordPress & Theme by Anders Norén