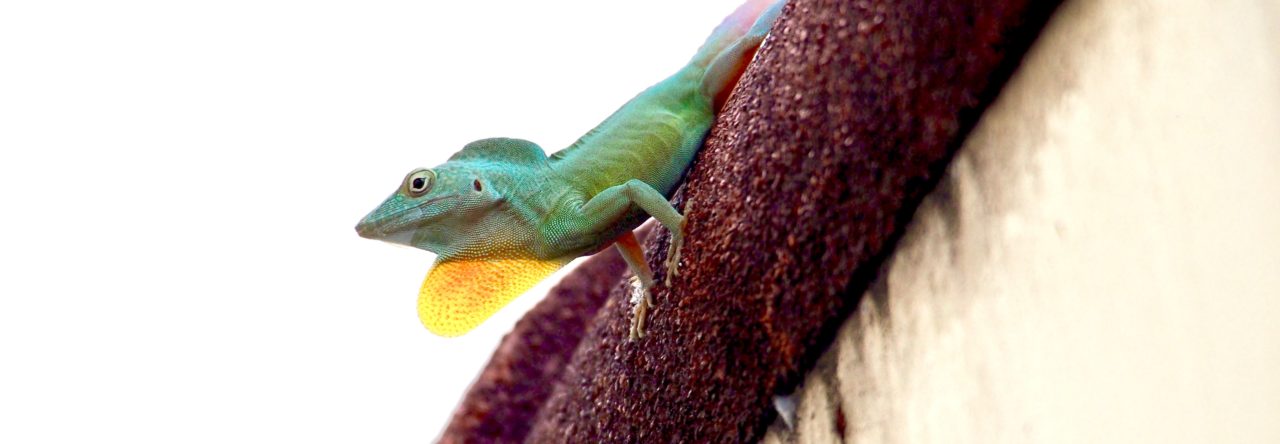

Uracentron flaviceps (upper photo) and Microlophus thoracicus (lower photo), two tropidurine lizards adapted to rainforests and deserts, respectively.
I was lucky enough to spend some months working at the Museum of Comparative Zoology of Harvard as part of the Losos lab. There I learned a good deal about anoles and got to meet anole-loving people face to face. Even though this atmosphere tempted me to develop a project related to one of the greatest examples of adaptive radiation, I had other plans in mind involving some of their distant cousins: tropidurine lizards! The results of this study are already published (Toyama, 2017) and I will describe a bit of what I found.
Tropidurinae is a group of lizards whose representatives have diversified across South America. They come in different shapes, colors and sizes, as you would expect from any group of organisms spreading in a diverse territory in terms of habitats, climates and altitudes. Rainforests, deserts, mountains and dry forests are just some examples of the different ecosystems where you can find these lizards. Given this scenario, I wondered if the morphological diversity observed in this clade could be linked to the challenges imposed by the different habitats types found in the continent.
Inspired by similar studies that focused on other lizard radiations, I took measurements of functional morphological traits of several species of lizards coming from 10 out of the 12 genera comprising the Tropidurinae. These traits would allow me to look for a possible correspondence between morphology and habitat.
However, as I was not only interested in the link between morphology and habitat use, but also in the morphological diversity itself, I started looking at purely morphological information. The next figure shows the illustrative results of a Principal Component Analysis (PCA), which tries to separate the species as much as possible based on the morphological measurements. In the figure, we can observe how the dots of each color (representing species of the same genus) occupy a particular zone in the graph. This means that, in general, species of the same genus are, as expected, morphologically more similar between them than to species of other genera (exceptions aside, given the overlaps between some genera).

Scatter plot showing the morphological space defined by PC1 and PC2. Each dot represents the average values for a species, and species are grouped in genera (colors). Abbreviations are shown for some traits as HL (head length), HW (head width), HH (head height), BW (body width), BH (body height), Dist (distance between limbs), Htoe (longest toe of the hind limb), and Ftoe (longest toe of the forelimb).
Going a bit farther in respect to morphological diversity, I also wanted to test which of the genera are the most diverse. To this end, I used a method involving Euclidean Distances (ED), which you can check in similar, previous works (Ricklefs et al., 1981; Losos and Miles, 2002). It basically consists of calculating the “morphological packaging” of each genera. For example, looking at the previous figure we can say that Stenocercus is less “compressed” in terms of morphology than Liolaemus, as the dots (species) of the first are more dispersed than the ones from the latter. This can be interpreted as Stenocercus being more diverse than Liolaemus in respect to morphology. I will come back to EDs later.
For the next step I included the effect of habitat use through a similar method, a Discriminant Functions Analysis (DFA). This time the method tries to separate different categories from each other, again using the morphological variables. I categorized the species into four different groups: arboreal, ground, rock and sand. As the next figure shows, each category is related to some extent to particular morphological traits, especially the arboreal species:

Scatter plot showing the morphological space defined by discriminant functions 1 and 2. Each dot represents the average values for a species, and species are grouped by habitat use category (colors).
I worked again with EDs with these results, following the same method I mentioned before. The results can be summarized in the next figures (the first graph based on the results of the PCA, the second based on the DFA):

Average Euclidean Distances for different genera. The upper and lower figures show the results using PCA and DFA scores respectively to calculate EDs. Solid black lines in the graphs represent the values expected by chance. Different genera are represented by symbols as showed in the figures.
The average ED for each analyzed genus is represented by a symbol (not all the genera are represented since some had just a few species). You would expect to obtain values of EDs equal to those represented by the solid black lines in the graphs if different morphologies originated by chance (like putting the dots on the previous two scatterplots in random places). The first graph, for which I used PCA scores as new morphological variables to calculate EDs, shows us that all but one genus averaged EDs lower than those expected by chance, which was the expected result. However, Stenocercus (square) showed an average ED equivalent to the value expected by chance, which suggests a high morphological diversity!
Moreover, looking at the next graph, for which I used DFA scores as the morphological variables, we see Stenocercus again showing average EDs equivalent to those expected by chance together with another genus, Tropidurus. This suggests that both genera show an outstanding diversity in terms of morphology related to habitat use (remember that species in the DFA are separated based on different habitat categories), which in turn would mean that they comprise species adapted to different habitats.
This was expected for the genus Tropidurus, known for including species adapted to different substrates (e.g. Bergallo and Rocha, 1993; Vitt et al., 1997a; Kohlsdorf et al., 2001; Grizante et al., 2010), but not for Stenocercus, as all of the species of this genus were initially categorized as ground-dwellers!
Stenocercus is a genus that has diversified in the Andes. A good amount of work is available in respect to its taxonomy and biogeography, but a lot less is known in respect to its ecology and behavior, which makes it difficult to speculate a lot about the causes of this surprising morphological diversity. However it leaves a new and exciting open question to be studied in the future. The Andes are known to have triggered diversification in other taxa, but we still don’t know how it can induce it in lizards.
Leaving this striking result behind, it’s time to test if habitat is really important to morphological diversification in these lizards. Using available information regarding phylogenetic relationships within this clade, I tested for the influence of habitat use in the morphological traits in a phylogenetic context. To summarize, habitat happened to have only a small influence on morphological diversity; of the first five principal components which I used to calculate EDs (you can check the paper for details), only the 4th and the 5th, which together explained around 10% of the total morphological variation, were significantly influenced by habitat differences between species. Looking at the individual traits, only one, the longest toe of the front limb, out of the 14 I considered in my study was significantly influenced by habitat. Posterior tests of phylogenetic signal supported these results, as phylogeny seemed to have an influence on all the traits.

Plica plica, an arboreal tropidurine lizard. The longest toe of the front limbs, a trait I found to be strongly influenced by habitat use, would be highly important for an arboreal lifestyle.
Even though most of the morphological diversity was not strongly influenced by habitat use, I found that the two principal components and the one trait that were significantly influenced by it were always different between arboreal lizards and the rest of lizards in the other categories! This suggests that an arboreal lifestyle is a characteristic capable of producing dramatic morphological changes beyond the constraints of phylogeny, at least in Tropidurinae. But who knows what other characteristics, not related to habitat use, could be having a similar influence?
The new open questions left by this large-scale study are proof of the exciting research opportunities this clade of lizards provides. Even though habitat use is known to be a highly influential ecological factor, this clade could be an example of how other characteristics might be playing a role in the evolution of morphological diversity, but only further research will tell.
References
– Bergallo, H. G., and C. F. D. Rocha. 1993. Activity patterns and body temperatures of two sympatric lizards (Tropidurus torquatus and Cnemidophorus ocellifer) with different foraging tactics in southeastern Brazil. Amphibia-Reptilia 14: 312–315.
– Grizante, M. B., C. A. Navas, T. Garland, Jr., and T. Kohlsdorf. 2010. Morphological evolution in Tropidurinae squamates: An integrated view along a continuum of ecological settings. Journal of Evolutionary Biology 23: 98–111.
– Kohlsdorf, T., T. Garland, Jr., and C. A. Navas. 2001. Limb and tail lengths in relation to substrate usage in Tropidurus lizards. Journal of Morphology 248(2): 151–164.
– Losos, J. B., & Miles, D. B. 2002. Testing the hypothesis that a clade has adaptively radiated: iguanid lizard clades as a case study. The American Naturalist 160(2): 147-157.
– Ricklefs, R. E., D. Cochran, and E. R. Pianka. 1981. A morphological analysis of the structure of communities of lizards in desert habitats. Ecology 62(6): 1474–1483.
– Toyama, K. S. 2017. Interaction Between Morphology and Habitat Use: A Large-Scale Approach in Tropidurinae Lizards. Breviora, 554(1), 1-20.
– Vitt, L. J., J. P. Caldwell, P. A. Zani, and T. A. Titus. 1997. The role of habitat shift in the evolution of lizard morphology: Evidence from tropical Tropidurus. Evolution 94: 3828–3832.
- Anole Bites Help Us Rediscover Rensch’s Rule - January 17, 2025
- An Evolutionary Trade-off of Strategies in the Bones of Anoles - November 26, 2023
- Exploring the Drivers of Sexual Dimorphism in the Green Anole - December 16, 2022
1 Pingback