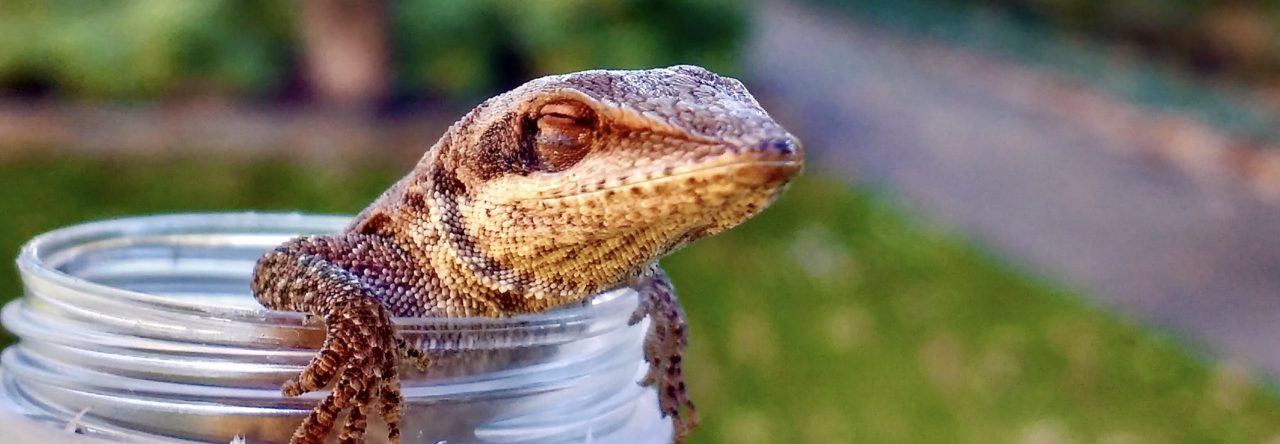
Anolis uniformis. Veracruz – Mexico
We recently published (together with Alex Tinius and Luke Mahler) a paper in Evolution in which we explore how the strength of the femur of Anolis lizards might be attained by two independent mechanisms, and how the interaction between them represents a previously unexplored axis of phenotypic diversity! I will try to summarize the main ideas here.
Since the beginning of my PhD, I’ve had almost unlimited access to the CT-scanner of the lab (the Mahler Lab at the University of Toronto) and to hundreds of anole specimens which we borrowed from many herpetological collections (we are very grateful to them!). The scanner allowed me to enter a world otherwise inaccessible: that of muscles, internal organs, fat, and bones. These are traits we are not used to thinking, but their characteristics can be described as well as we do with more familiar traits like the length of a limb or the color of a dewlap.

Looking at anoles through the eyes of a CT scanner
In the beginnings of this project, I focused on the bone mineral density (BMD) of the femur. BMD is positively associated with the bending strength of the bone and, given the classical ecomorphological relationships shown by anoles which link limb morphology and habitat use, I expected the BMD of the femur to be relevant to their evolution. With this in mind, I started collecting BMD data from as many anole species as I could.
At some point while reading papers, I came across the fact that not only mineral density, but also the cross-section shape of the femur (or any other long bone) influences its bending strength (Currey, 2003; Dumont, 2010; Jepsen, 2011). In theory, if you have a cylindrical hollow bone (like a femur) with a given mass and density, the best way to make it stronger is to redistribute the bone tissue such that the walls are as far as possible from the center of the cylinder (i.e., to make the walls thinner). In other words, if r is the radius of the inner ‘hollow’ volume, and R is the total radius of the femur, increasing r/R increases the bending strength of the bone. This, in consequence, results in a bone with a larger diameter and a relatively larger ‘hollow’ volume in its center:

Build a hollow cylinder with a given mass of bone tissue: a strong configuration is that where the walls are as far as possible from the center (i.e. a configuration with thinner walls, or high r/R, where r is the inner radius and R is the total radius of the femur). Notice, however, that increasing the diameter too much makes the bone too heavy, and making the walls too thin makes it too fragile against other forces.
However, you cannot go on increasing BMD and the hollowness of the bone forever. One reason for this is that the bone eventually becomes too heavy to be functionally viable. Higher density increases weight for obvious reasons, but increasing the hollowness of a long bone eventually increases its weight because the ‘hollow’ part of the bone is actually not hollow in live animals, but is full of fat which, of course, contributes to the total mass of the bone.
Bone mineral density and “hollowness” then represent two independent ways to increase the bending strength of a long bone. But since these two determinants of bone bending strength are limited by their cost to fitness (e.g., due to excessive weight), we expected a certain balance between the two. Some sort of trade-off in which a species either has high-density, thick-walled bones or low-density, thin-walled bones, or any intermediate strategy between these two extremes:

Shape and BMD are two independent determinants of femur bending strength. However, they are both costly to fitness and cannot be simultaneously maximized (upper-righ grey area). On the other hand, bones with low BMD and low r/R values would be too weak (lower-left grey area). This leaves a narrow band in the phenotypic space where different viable BMD-shape combinations could exist.
Excited by this new idea, we started complementing the BMD measurements with shape measurements (r/R). Would we find the expected trade-off? As we started plotting species-level data for femur BMD and shape, it started to be clear that a negative association was there. Eventually, our results indicated that there is a strong evolutionary correlation between the hollowness of the femur (represented by r/R) and BMD, both considering only males or only females:

Negative evolutionary correlation (r in the upper part of each figure) between cross-sectional shape (r/R) and BMD in Anolis lizards considering only males (left) or females (right). Each point corresponds to a species.
This was very exciting because the association was clear and strong! The construction of anole femora seemed to be limited to combinations found in a narrow band in phenotypic space, as expected. But this apparent constraint can also be understood as an opportunity for phenotypic diversification. If both variables, BMD and shape, are important enough to influence bone bending strength and simultaneously represent costs to fitness, a hypothetical trade-off between them would result in a spectrum of viable strategies to build a femur. In other words, there would be more than a single way to build a strong, viable femur!

However, we still had to test whether all these strategies were resulting in equivalent levels of bone strength. For this we calculated a bone strength index (BSI), a variable that depends on both BMD and shape and which has been shown to be consistent with experimentally measured bone strength. If the different combinations along the spectrum of available strategies can really provide equivalent levels of performance, the negative relationship between BMD and shape should align with performance isolines in that same phenotypic space (i.e., the negative relationship should be parallel to isolines of equivalent performance).
That’s roughly what we found! After accounting for size, the spectrum of existing strategies seemed to align with isolines of performance, meaning that a femur with a particular strength could be obtained through different shape-BMD combinations. This is similar to a many-to-one mapping pattern, except that here we are not talking only about morphological traits, but the interaction between architectural design and the material properties of a structure.

Relationship between size-corrected r/R and size-corrected BMD in Anolis lizards, plotted on a size-corrected bending strength performance map. Note the broad correspondence between the compensatory relationship between anole femur architecture (r/R) and material properties (BMD) and the size-corrected BSI isolines (bands of uniform color) across the plane. Each point corresponds to a species. Left and right panels show data based on males and females, respectively.
Finally, we tested whether anole species under different selection pressures had actually evolved to use different parts of the spectrum, taking advantage of this evolutionary flexibility. To do this, we compared the strategies used by island and mainland anole species.
Specifically, we hypothesized that mainland anoles, short-lived species with faster life paces (Andrews, 1976, 1979; Lister and Aguayo, 1992), would not have enough time to reach high mineralization levels in their bones (it’s been shown in other species that bone mineralization is a lengthy process whose peak is often reached way after sexual maturity; Bala et al., 2010; Bonjour et al., 1994) and thus would tend to evolve strategies based on higher r/R values (i.e., mainland species should evolve hollower bones to compensate for low mineral density). We expected island species to show, on average, the opposite strategy. Different pieces of evidence (detailed in the paper) supported this hypothesis!:

Island and mainland anole species follow different strategies for evolving strong bones. (A) shows the relationship between femur cross-section shape (r/R) and bone mineral density (BMD) for anole species. Violin plots in (B) and (C) compare island and mainland species averages of r/R and BMD. Blue squares and green circles represent island and mainland species, respectively. Plots show results when considering only males.
Previous medical papers had proposed and, to certain extent, demonstrated the compensatory relationship between BMD and bone architecture in the bones of humans, mice, and others. However, a macroevolutionary relationship between both variables had not been tested yet. Our results show a species-level pattern consistent with this compensatory mechanism.
Overall these results show how a many-to-one system of form to function can include not only morphological traits, but also the material properties of biological structures. This suggests that the way phenotypes evolve is, as usual, more complex than we previously thought, especially when certain traits are not so easy to study.
This many-to-one system has not only resulted in the evolution of phenotypic diversity in a single trait, but might have also favored the diversification of anoles under contrasting selection pressures. Although femur evolution is constrained by the need to achieve a minimum performance level, plus the physical and viability limits imposed on its structure, the possibility that its performance has two independent determinants (BMD and shape) represents an opportunity for the evolution of alternative phenotypes. This flexibility might have facilitated anole evolution across environments where one determinant is constrained, which could have been the case for mainland anoles as hypothesized in our paper…
I invite you to read the original paper for more details!
References
Andrews, R. M. (1976). Growth rate in island and mainland anoline liz- ards. Copeia, 1976(3), 477–482. https://doi.org/10.2307/1443362
Andrews, R. M. (1979). Evolution of life histories: A comparison of Anolis lizards from matched island and mainland habitats. Breviora, 454, 1–51.
Bala, Y., Farlay, D., Delmas, P. D., Meunier, P. J., & Boivin, G. (2010). Time sequence of secondary mineralization and microhardness in cortical and cancellous bone from ewes. Bone, 46(4), 1204–1212. https://doi.org/10.1016/j.bone.2009.11.032
Bonjour, J. P., Theintz, G., Law, F., Slosman, D., & Rizzoli, R. (1994). Peak bone mass. Osteoporosis International, 4, S7–S13.
Currey, J. D. (2003). The many adaptations of bone. Journal of Bio- mechanics, 36(10), 1487–1495. https://doi.org/10.1016/s0021- 9290(03)00124-6
Dumont, E. R. (2010). Bone density and the lightweight skeletons of birds. Proceedings of the Royal Society of London. Series B: Biological Sciences, 277(1691), 2193–2198. https://doi.org/10.1098/rspb.2010.0117
Jepsen, K. J. (2011). Functional interactions among morphologic and tissue quality traits define bone quality. Clinical Orthopaedics and Related Research, 469(8), 2150–2159. https://doi.org/10.1007/ s11999-010-1706-9
Lister, B. C., & Aguayo, A. G. (1992). Seasonality, predation, and the behaviour of a tropical mainland anole. Journal of Animal Ecology, 61(3), 717–733. https://doi.org/10.2307/5626
Toyama, K. S., Tinius, A., & Mahler, D. L. (2023). Evidence supporting an evolutionary trade-off between material properties and architectural design in Anolis lizard long bones. Evolution, qpad208.


