Category: New Research Page 2 of 67

Do Anoles Display with Greater Complexity than English?

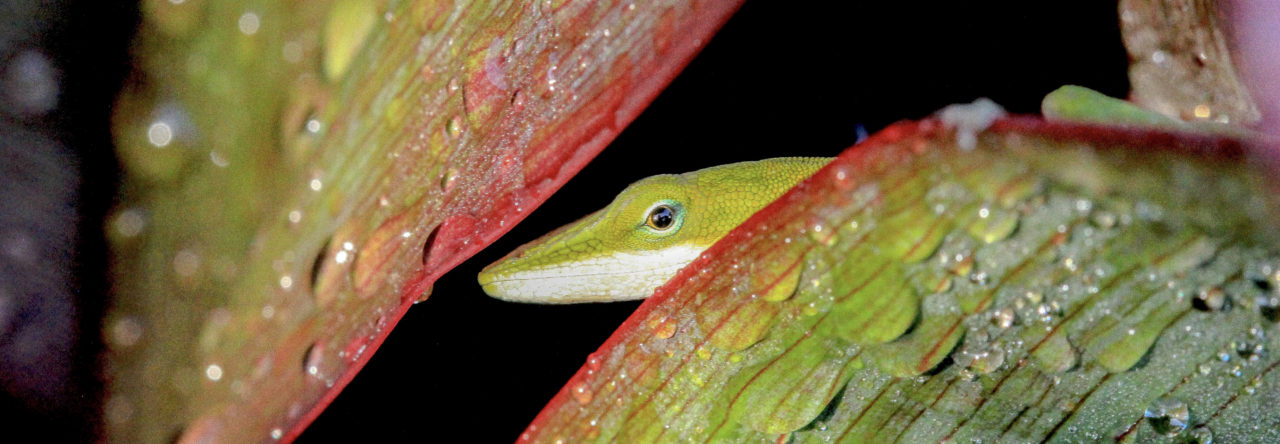
Above: the territorial display of a male Anolis stratulus on Puerto Rico

Take the time to watch the displays of an anole and you might appreciate how elaborate those signals seem to be. And by comparison to other lizard species, the anole display is arguably one of the most complex. Not only do anoles communicate with the up/down movement of head-bobs, but with the repeated extension of a large dewlap that in itself is often spectacularly colored. These displays are used to convey a variety of messages, from advertising the ownership of territories to the attraction of mates. We know the display is packed full of detail on species identity too.

But how do we go from gut impressions of what is complex to properly measuring the complexity of lizard displays, or any form of animal communication for that matter, including human language? The main way scientists have done this is by essentially counting the number of different components and using that to estimate an animal’s communication repertoire. There are various problems with this, such as deciding which components are different enough to count. It’s the most common method probably because it’s the easiest, but it is also the crudest. It offers only a basic view of signal complexity, missing the complexity inherent within components making up the repertoire.

An alternative approach is to apply some math from physics to measure the information potential of a signal. It is better than simply counting things because it measures the complexity of the entire signal, including the number of different components and the elaborations within those individual components as well. Best of all, it doesn’t require any decisions on what parts of a signal might be worth counting. It also provides a common, repeatable index of complexity that can be used to compare signals from very different animals, such as anole displays and human language.

So, how do anole displays stack up?

Want to know whether Anolis pulchellus on Puerto Rico has the most complex display? Read the paper and find out!

First, let’s consider some other lizards. The head-bob displays of sagebrush lizards (Sceloporus graciosus) are fairly representative of other species of fence lizards, and they clock in at 4.26 bits of information per display. “Bits” is a general unit for the amount of ‘information’ (think data) that can be “potentially” encoded in a signal, or its “information potential” for short. The number is largely meaningless by itself. The songs of birds would probably be the most obvious rivals of complexity in nature. Chickadees have 4.64 to 5.79 bits per song. But is that effectively the same or way more complex than sagebrush lizards? We need more benchmarking.

How about the famous waggle dance of the honeybee? The waggle dance was first uncovered by Karl von Frisch who found that it was a highly accurate signal conveying the direction and distance to an outside nectar source to worker bees inside the hive (google it, it really is super interesting). This discovery later contributed to von Frisch winning the Nobel Price alongside Konrad Lorenz and Nikko Tinbergen. von Frisch was also one of the first scientists to apply information theory to animal communication. The honeybee waggle dance comes in at 7.43 bits per dance. Bees are more complex than birds!

If we apply the same method of measuring complexity to written English, we find it has about 8.12 bits per word. Now let’s recap: sagebrush lizards are 4.26 bits per headbob display, chickadees are 4.64-5.79 bits per song, the honeybee waggle dance (my personal favourite) is 7.43 bits per dance, and written English is about 8.12 bits per word. Those comparisons in themselves are very interesting, but what about anole displays?

We’ve comprehensively measured the male territorial displays of eight different species of Puerto Rican anole and published our findings in Behavioral EcologyWhen I say comprehensive, I mean just that: we measured dewlap colour pattern, the way in which the dewlap is repeatedly extended and retracted during the display, the pattern of movement of both push-ups and head-bobs, and a variety of other behaviors often seen accompanying territorial displays (e.g., tail curls and flicks).

The least complex part of the display is the dewlap colour pattern. At best, it encodes 1.02 bits per dewlap pattern. That’s for a dewlap with at least four different colours. The movement of the dewlap during the display—the timing of the in/out movement, how much the dewlap is extended—has far more information potential with as much as 3.87 bits per display. The sequence of head-bobs is the most complex aspect of the anole display and can be as high as 5.11 bits per display. Considering the entire display, the complexity of the territorial display ranges from 6.54 bits per display in Anolis poncensis to a whopping 15.40 bits per display in Anolis pulchellus.

15.40 bits per display! Does this mean anole displays are more complex than written English? Yes! And no. The estimate for written English—8.12 bits per word—was for single words, not a sentence, a paragraph or an encyclopedia. But the fact that anole displays are as complex as they are and might outclass songbirds is truly amazing.

It is contentious as well. During peer-review of our paper, some scientific referees found the reported values hard to digest. All of them thought our numbers for anoles were correct, but couldn’t accept that signals of mere lizards might be more complex than those of songbirds. The comparison to written English drew so much heat that we had to remove comparison to it from the paper entirely. The referees had various reasonable points. One referee highlighted that the value for written English was for single words, not whole texts (fair enough). Another referee suggested our application of information theory was more comprehensive than how it has been previously applied. The implication being other studies have tended to focus on measuring the easiest things and not the full breadth of a song (hmm…).

If you want to find out which Puerto Rican anole species varied most in display complexity and the adaptive explanations of why, or what might have driven the evolution of such complex signals in anoles to begin with, you’ll have to read our paper. Email me and I’ll send you a free copy.

Anoles outclass songbirds? Why not, I say. Perhaps in communicative complexity, but certainly on many other scales.

Inferring Where Anole Ranges Tend to Spread or Split

When I mentioned to Jonathan Losos that I had applied a new biogeographic model to anoles, he gave me a copy of Lizards in an Evolutionary Tree. What could I do but take it as both a generous gift and gentle suggestion? This is all to say that I’m no herpetologist. I know this, and so should you. I write humbly to the AA readers as a twig anole standing on the shoulders of crown-giants.

With that said, several close colleagues (Ignacio Quintero, Martha Muñoz, Felipe Zapata, Michael Donoghue) and I recently had a paper published that introduces a new modeling framework that allows regional features of geography to inform phylogenetic rates of dispersal, extinction, and speciation – called FIG (Feature-Informed GeoSSE). We then applied FIG to the phylogenetic and biogeographic Anolis dataset published by Steven Poe and co-authors. This piece summarizes that work and subjects its readers to a few lame jokes.

Cartoon of FIG model behavior.

The first aim of our project was to propose a new framework for modeling historical biogeography using GeoSSE, a diversification model introduced by Goldberg et al. (2011). Under GeoSSE models, all species occupy different sets of regions in a shared geographical arena. As time advances, species stochastically disperse, go extinct, and speciate. Speciation itself might occur within a region or between regions (e.g., in a manner consistent with allopatric speciation).

Thinking realistically, when and where these events happen should somehow depend on the set of regions each species occupies and the geographical features of the relevant regions. Unless instructed otherwise, however, GeoSSE estimates every possible event rate from phylogenetic and biogeographic data alone. Regional features of geography aren’t used. This leaves historical biogeographers with at least one technical problem and one missed opportunity.

First, concerning the technical problem, the number of event rates explodes with the number of regions. A geographical system with two regions (A and B) requires seven rate parameters: two within-region speciation rates for regions A and B, two extinction rates for A and B, two dispersal rates for A into B and B into A, and one between-region speciation rate for splitting the widespread ancestral species with range A+B into two daughter lineages with ranges A against B. Three regions requires 18 rates, four regions requires 45 rates, and so on. Between-region (“allopatric”) speciation rates and, to a lesser degree, the dispersal rates fuel this explosion in rate parameters. Somehow the number of rates must be reduced if we hope to estimate any of them at all.

In FIG, regional features (size, distance, barriers) can inform event rates. Different features are free to have different relationships with each process. For example, region size may increase within-region speciation rates while decreasing local extinction rates. Distance may decrease dispersal rates but increase between-region speciation rates. FIG also allows for barriers and distances to inform the rate and way in which a widespread range splits following between-region speciation.

Second, concerning the missed opportunity, biogeographers often hypothesize how geographical features should influence evolutionary outcomes – for example, that a single species should “split” in two more rapidly when its range is subdivided by a barrier – but GeoSSE has not really been used to test such hypotheses, in large part because of the technical issue mentioned above.

For hypothesis testing, FIG analyses estimate the probability that each geographical feature has an effect on a corresponding class of evolutionary rates. This is done with Bayesian reversible-jump Markov chain Monte Carlo to turn “on” and “off” different relationships between features and rates. For example, if FIG estimates that the effect of distance on dispersal was “on” in 97% of MCMC samples, you might make the bold claim that distance influences dispersal rates between regions. Or, if the effect of size on extinction was “on” in only 31% of samples, you might say no conclusive relationship or non-relationship was detected.

The other aim of our work was to see if FIG produced any biologically interesting inferences. If not, why bother? Anolis led the pack when selecting a clade to feature for empirical analysis. Anoles are well-known for their distribution throughout the Caribbean and the neotropical mainland, with some expectation of moderate, but not rampant, dispersal. Because anole phylogeny and biogeography has been studied in such detail over the decades, the clade is also ideal for test driving phylogenetic models.

Geographical distribution of Anolis.

We adapted the Poe et al. (2019) dataset into a nine-region biogeographical system with five continental and four insular regions of varying sizes and distances. There are ~380 anoles in this dataset, with nearly as many insular as continental species, but nearly [*] all widespread anoles are restricted to adjacent continental regions. This is exactly the type of pattern you’d expect to see if geographical distance and oceanic barriers restricted anole movement. That is, widespread fragmented ranges should be difficult to maintain and should therefore be rare.

Biogeographic rates. Left: extinction (nodes) and dispersal (edges) rates. Right: within-region speciation (nodes) and between-region speciation (edges) rates.

Reassuringly, FIG inferred that dispersal was limited by distance, especially over water. Similarly, between-region speciation rates split ranges the fastest when the inhabited regions were far apart and/or separated by water. Region size and island-status did not have a predictable effect (or non-effect) on extinction and within-region speciation rate. The network diagrams above summarize different regional rates of evolutionary change.

Dispersal rates, between-region speciation rates, and distances.

We also were interested in a critical distance that we defined – the maximum range cohesion distance – beyond which widespread species tended to split into two rather than remain as one. The idea is that if dispersal rates are low, interpopulation migration rates should be low, and therefore rates of allopatric speciation should be high. If we assume that FIG’s dispersal rates approximate the rates of pulsed migration needed to maintain gene flow between regions, we predicted the corresponding distance at which organismal movement became too slow to maintain range cohesion. So how far is too far?

Our scrappy little estimator predicted that range cohesion is almost certainly degraded beyond ~470km over land and ~160km over water. As it turns out, six pairs of continental regions had average distances closer than 470km, where we find all widespread continental anoles today. We don’t expect that these distances perfectly describe the limits of range cohesion for all anole species in all contexts, but a cursory review of the anole population genetic literature convinced us that our estimates were at least reasonable.

Extinction rates, within-region speciation rates, and sizes.

We didn’t recover an analogous relationship for the ratio of extinction and within-region speciation rates with region size. But neither does FIG reject those relationships. Still, recalling the histogram of regional species richness above, it seems unlikely that size alone dictates richness in anoles across continental and insular regions – as they’re defined here – since Amazonia has so few species relative to much smaller regions, like the island of Hispaniola. More work on this issue is needed.

In its conclusion, our paper reflects on how phylogenetic models of biogeography treat allopatric speciation. With anoles under FIG, for example, the consequence of dispersal into a new region depends on the geographical context. If dispersal is between adjacent continental regions, dispersal tends to result in range expansion. But, if dispersal is between distant regions or involves insular regions, it tends to result in cladogenesis that’s consistent with allopatric speciation. In large part, this inference was made possible because regional features inform evolutionary rates in FIG, letting us predict where anoles tend to “split or spread.” We think this historical view of allopatric speciation in a phylogenetic context will be worth exploring further.

Not to pander, but Anolis has played and continues to play such an instrumental role in the development of biologically meaningful models of ecology and evolution. Many of the statistical phylogenetic models that I’ve looked to for inspiration in my own research over the years were introduced by anolologists. Maybe this is a second meaning for model clade? Rambling aside, our project was a true collaboration among some of the most creative organismal and mathematical biologists I’ve known. Our hope is that our small contribution lives up to the high standard of modeling anole diversity.

*–An innocent question from an outsider: is A. sagrei really a single species? Pretty wild.

Paper:
MJ Landis, I Quintero, MM Muñoz, F Zapata, MJ Donoghue. 2022. Phylogenetic inference of where species spread or split across barriers. Proceedings of the National Academy of Sciences 119: e2116948119. doi:10.1073/pnas.2116948119

Code:
https://github.com/mlandis/fig_model

Lab site:
http://landislab.org

Body Condition and Jumping Predict Initial Survival in a Replicated Island Introduction Experiment

Back in 2014, collaborators Panayiotis Pafilis, Anthony Herrel, Johannes Foufopoulos and I initiated a multi-island lizard introduction experiment, inspired by the foundational anole evolutionary ecology work of Losos, Schoener, and Spiller. Our twist: we were going to do it in Greece, with a different genus of lizard – Podarcis. Wall lizards haven’t radiated like anoles, but there is fascinating work demonstrating rapid evolution in the genus and a large descriptive literature documenting the phenotypic differences of populations living on mainland, large islands, and small islands.

We introduced 20 marked individuals from the large, predator-rich island of Naxos to each of five Podarcis-free islets, and revisited the populations annually (up until pandemic), censusing each island. Each year we gathered new morphology, performance, behavior, and diet data, and released the lizards back to the experimental islets. We’ve just published a new paper showing that the traits that best predicted initial survival were not all the ones we’d expected. Body condition – sure – lizards with a higher body condition probably have the reserves that enable them to weather the stressful introduction. Bite force? Not so much. We’d expected bite force to be an important predictor of survival because lizards with harder bites would be more competitively dominant and also have access to defended prey items like gastropods. Contrary to our expectation, bite force was not a predictor of survival (but stay tuned, bite force has become more and more important as the experiment has continued).

If you’re interested, I’ve written lots more about the experiment on my blog over the years. We also have photos and videos from the islets:

Finally, a quick call to the community: I have six years of tissue samples from the five islet populations, but don’t have the molecular chops to ask any of the fantastically interesting questions we might be able to with paired survival, phenotype, and molecular data. If you’re interested in a collaboration, let me know!


New Literature Alert:

Colin M Donihue, Anthony Herrel, Johannes Foufopoulos, Panayiotis Pafilis, Body condition and jumping predict initial survival in a replicated island introduction experiment, Biological Journal of the Linnean Society, 2022;, blab172, https://doi.org/10.1093/biolinnean/blab172


Abstract: Over-water dispersal to small islets is an important eco-evolutionary process. Most often, new arrivals on islets find the environment harsh or mate-less, making their footholds on these islets fleeting. Occasionally, introduced animals are able to survive the strong selection following their arrival, leading to subsequent propagation and, in several famous cases, adaptive radiation. What traits predict that initial survival? We established a replicated island introduction experiment to investigate this process in lizards. In 2014, we introduced 20 Podarcis erhardii lizards to each of five small islets in the Greek Cyclades Islands. We found that the lizards that survived were those with better initial body condition, longer distal portions of their limbs and a greater propensity for jumping. Contrary to our expectations, neither body size nor the strength of the lizards’ bite – two traits positively related to competitive ability, which becomes important later in the colonization process in lizards – predicted survival. This is the first selection study of its kind investigating an experimental introduction of Podarcis, and whether the traits that determined initial survival are important in driving the future evolutionary trajectories of these populations remains to be determined.

How Do Anole Species Tell Each Other Apart?

When it comes to finding a mate or defending a territory, animals need to recognise members of their own species. The reasons are intuitive: you only want to mate with your own species to ensure viable offspring, and you should only invest the effort in being territorial when confronted by rivals from your own species. There are exceptions and these are interesting—hybridization or territorial competition between species—but generally animals need a system for species recognition.

The large, often spectacularly coloured throat fan or dewlap of anoles seems like an obvious way to evaluate species identity. Taxonomists have historically thought so, too. Each species appears to display a dewlap that’s unique in colour and pattern. But there are various Anole Annals posts highlighting this is not always the case. Instead, the colour of the dewlap is often an adaptation to the light environment for enhancing the detection of territorial displays.

So what about those territorial displays? Might anoles use the complex movements of the head-bob and push-up display to figure out species identity?

Classic work by Charles Carpenter and Tom Jenssen revealed how often the head-bob movements of lizards, and anoles in particular, seemed specific to each species. Pioneering experiments using video playback by Joe Macedonia in the ’90s has also provided evidence that anoles are able to distinguish displaying rivals of their own species from those of other species. But what is it about the pattern of movements used in the head-bob and push-up display, or even how the dewlap is extended and retracted, that conveys species identity? Is there one feature that varies the most among species that anoles commonly rely on to identify species?


Display-Action-Pattern graphs (above) showing the complexity of movements used by Puerto Rican anoles for territorial advertisement displays

These are hard questions to answer. Anole displays are complex, using many different types of movements, so there’s a huge number of possibilities. One approach would be to isolate and manipulate each type of movement and use video or robot playbacks to ask the anoles themselves. But doing that would take an entire career. There are a seemingly infinite number of combinations to consider. In fact, it would be impossible without a way to narrow things down.

Claire Nelson is a creative (and courageous!) graduate student who had an eye for solving the challenge. She figured it was possible to leverage the large archive of footage I’d accumulated over many, many years. These videos were of free-living male lizards performing territorial advertisement displays. Her idea was to develop an objective method for identifying which movements used in the head-bob, push-up or dewlap display had the potential to convey species identity. She’s just published her solution in Animal Behaviour.


Claire (above) doing a balancing act with some non-anoles

Claire used this archive of display videos to create Display-Action-Pattern graphs, a method developed by Carpenter back in the 60s. These track the up-and-down movement of head-bobs and push-ups as well as the extensions and retractions of the dewlap during the territorial display. To keep it manageable, she limited her efforts to anole species on Puerto Rico, and graphs of about 10 territorial advertisement displays per male. But there was an important biological reason for selecting this number of displays as well. It effectively mimicked the number of displays an anole might typically see on first encountering another lizard. That is, anoles likely make judgements on species identity from only a handful of displays.

From these Display-Action-Pattern graphs, Claire took a host of measures, ranging from the duration and number of movements used, to variation in amplitude and pauses between movements. She also noticed that anoles tend to perform certain combinations of movements together in what she came to call ‘motifs.’ After many many hours of effort, Claire accumulated a huge amount of data for nearly 20 different types of display movement for eight Puerto Rican Anolis species, and in many cases, for different populations of the same species.

Claire asked me for advice on how to analyse it all. I have to admit I was completely useless on this front. I muddled something about using coefficients of variation and some other nonsense, but really I had no idea. I was still in shock over how much data she had accumulated, and the novelty (and implications) of discovering motifs in the displays. She knew what she was doing, though. Her analytical solution was vastly superior to anything I could have suggested.

Claire investigated a variety of approaches, but in the end she settled on the method of random forest tree classification. It’s a sophisticated machine learning algorithm that, in a nutshell, takes data and groups like with like. It doesn’t require any prior direction or preconceived notion on how data should be grouped. It just uses the variation in the data itself. You could view the algorithm as an anole brain using basic rules of variation to make judgements on which displays are likely to be different and which displays are likely to be the same.

The outcome was impressive. The algorithm correctly assigned the vast majority of lizards to their correct species based on just a handful of displays. Where errors occurred, it was partly because lizards were assigned to the right species, but the wrong population. This means anoles from different populations tend to share some display features because they’re still from the same species. Yet the algorithm was able to correctly assign most lizards to the right population. In other words, there was still enough variation in the displays between populations of the same species to identify them as belonging to separate populations. This is very interesting!

Random forest tree classification (above) can assign over two thirds of displaying lizards to their correct species.

The evolution of new species begins with individuals of the same species starting to segregate from each other in some way. Often it’s physical separation (on opposite sides of a mountain range), but changes in social signals can also prompt behavioral separation as well. This could be the case for some anoles on Puerto Rico. Once individuals stop recognising each other as the same species, they no longer reproduce with one another, and the door to speciation is propped open.

The other discovery Claire made was the apparent lack of any common display feature that could be used to identify species (and population identity). Instead, different features were important for different species. The duration and number of headbob movements were features that could be used to identify the territorial displays of Anolis poncensis—a species that is striking in its use of lots of extremely rapid, up and down body movements—whereas the way the dewlap was extended was influential in identifying different populations of Anolis gundlachi—a species that has an unusually long dewlap display. Other species like Anolis pulchellus and Anolis krugi were best identified by effectively considering features of the entire territorial display.

Whether or not anoles actually use the features identified by the algorithm in species recognition remains an open question. But Claire has managed to identify the potential candidate cues that could be used. It is now possible to develop a focussed research program to test whether, and how, anoles used these features to identify species. Again, the obvious way to do this would be to ask the lizards themselves using robot playbacks.

Random forest tree classification sounds awfully complicated, and it is very sophisticated, but it’s actually easy to implement. Any dummy can do it. I taught myself how and wrote a step-by-step tutorial so you can as well. We’ve published this tutorial alongside Claire’s paper in Animal Behaviour. Give it a whirl!

Making the Fancy Feet of Anoles and Geckos

A mourning gecko (Lepidodactylus lugubris) climbing vertically on glass with the help of its impressive toe pads.

I think most people visiting Anole Annals could argue that the adhesive digits of anoles are some of the most fascinating aspects of their biology (or maybe I’m just biased). Digital adhesion is accomplished through toe pads: a collection a broad, modified plantar scales which bear thousands upon thousands of microscopic, hair-like structures (i.e. setae). Through frictional and van der Waals forces, these collections of setae allow toe pad-bearing lizards to easily access vertical surfaces and exploit habitats many lizards cannot. Shockingly, adhesive toe pads have independently evolved several times across lizard evolutionary history (at least 16 times by recent estimates) — once in the common ancestor of anoles, once in a clade of southeast Asian skinks, and 14 times in geckos. Both within and between the different evolutionary origins of toe pads, there is substantial variation in toe pad size, shape, number of scansors/lamellae, and position of the adhesive apparatus.

In our recent study, my collaborators and I took the first steps to characterize how embryonic development is modified to achieve this incredible diversity. Using embryonic material my coauthor Thom Sanger collected as a postdoctoral researcher in Marty Cohn’s lab, in addition to embryonic material I collected over the course of my Ph.D. training in Tony Gamble‘s lab, we aimed to compare embryonic digit development of ancestrally non-padded lizards with that of anoles and padded geckos. We used a model clade approach to broadly sample anoles and geckos, although some species breed more easily in the lab and have more embryological resources than others. All together, we sampled a range of toe pad morphologies in both clades (trunk-ground and trunk-crown Anolis ecomorphs and leaf-toed and basal pads in geckos). To help polarize the developmental changes leading to the origin of toe pads, we also included two ancestrally padless species in our comparisons. After the collection of these diverse embryos, we used scanning electron microscopy (SEM) to characterize scale morphology of the digits throughout embryonic development.

By comparing embryonic material of anoles and geckos, we essentially span the diversity of squamates in a single comparison.

Because of the ~200 million year divergence between anoles and geckos and dramatic differences in adult morphology, we anticipated that we would see stark differences in the developmental origins of toe pads in these species. To our surprise, we found striking similarities in toe pad development between all of the pad-bearing species we examined. We found that toe pads develop after digit webbing recesses. In all pad-bearing species, ridges that become the adhesive scansors and lamellae first form in the distal half of the digit. Throughout development, new ridges begin forming in the proximal direction while the previous ridges begin to grow laterally. Elaborations and derivations in toe pad form, such as bifurcation, occur in the latter-half of embryonic development. The presumably ancestral pattern of plantar scale development we observed in our leopard gecko and fence lizard embryos (both species lacking adhesive digits) demonstrated that scale ridges form all at once along the length of the digit. These differences are similar to those documented between developing non-padded gecko tails and padded tails of crested geckos. This means that anoles and geckos have converged on a similar developmental process! We suggest that toe pads are initially formed through a major repatterning of digital development and then variation is achieved through relatively minor “tinkering,” through either timing or location of developmental patterns.

Scanning electron micrographs (SEMs) of embryonic lizard digit development, progressing from early development (left) to late development (right). The pad-bearing brown anole (Anolis sagrei) and mourning gecko (Lepidodactylus lugubris) have converged on scansor ridges forming in a distal-to-proximal direction, while the paddles leopard gecko (Eublepharis macularius) has scale rows forming all at once along the length of the digit. Lizard photos courtesy of Dr. Stuart Nielsen.

This is by no means the end of this story. We’ve just scratched the surface and there are a several directions to head in. A logical next step is to characterize histological organization through toe pad development. From there, characterizing the genes involved in toe pad morphogenesis, in tandem with the possibilities of new gene editing technologies, would allow us to test mechanisms of toe pad formation and how variation is generated. And, of course, characterizing toe pad development in other species (such as the secondarily padless Anolis onca) may elucidate further conservation or derivation from the trends we found. This is an exciting time to be a toe pad biologist!

Repeated Evolution of Skin Surface Micro-Architecture and Increased Hydrophobicity in Semi-Aquatic Anoles

A Stream Anole (Anolis oxylophus) on the cover of the Journal of Experimental Biology (vol. 224, issue 19). Photo credit: © Day’s Edge Productions.

Terrestrial animals that venture into the water on a regular basis face a number of challenges not encountered by their strictly terrestrial counterparts. While submerged, they must deal with hydrodynamic drag forces hindering locomotion and with the risk of running out of air. Back on land, the film of water adhering to their body surface may interfere with locomotion and thermoregulation or may increase the risk of bio-fouling. Many semi-aquatic invertebrates (and plants) have developed complex surface microstructures with water-repellent properties to overcome these problems, but equivalent adaptations of the skin have not been reported for vertebrates that encounter similar environmental challenges.

The transition to a semi-aquatic lifestyle has independently occurred multiple times throughout the evolutionary history of Anolis (see Fig. 1A below). In anoles, the skin surface is covered with microscopic hair-like ornaments, and contingent upon its complexity, organization, and length dimensions, these hair-like microstructures may have the potential to generate extreme surface hydrophobicity. Indeed, similar skin surface microstructures have been found in geckos and are shown to be responsible for the highly hydrophobic surface of their skin. The water-resistant properties of anole skin, however, have remained unexamined, but very recent discoveries have provided valuable insight into this matter. Boccia et al. (2021) observed that semi-aquatic Anolis lizards are able to sustain long periods submerged underwater by iteratively expiring and re-inspiring narial air bubbles. As in semi-aquatic insects, a hydrophobic skin is a key requirement for the underwater formation of an air bubble, hence, functional respiration, so a hydrophobic skin in semi-aquatic anoles is implied. However, whether a hydrophobic structured skin surface in anoles has evolved in response to life at the water-land interface is still an open question. Answering this question was the primary goal of our study.

We studied the skin surface morphology of preserved anole specimens using scanning electron microscopy and tested the wettability of the skin surface using contact-angle goniometry (Fig. 1D). We found that the skin surface of semi-aquatic species of Anolis lizards is characterized by a more elaborate microstructural architecture (i.e. longer hair-like structures; Fig 1B,C) and a lower wettability (Fig. 1D,E) relative to closely related terrestrial species. In addition, phylogenetic comparative models revealed repeated independent evolution of enhanced skin hydrophobicity associated with the transition to a semi-aquatic lifestyle, providing evidence of adaptation.

Figure 1 from Baeckens et al. (2021)

We believe our findings bring an additional dimension to the recent biological phenomenon described by Boccia et al. (2021) namely that diving Anolis lizards not only repeatedly and independently evolved a specialized rebreathing behavior with the transitioning to a semi-aquatic lifestyle, but that its evolution presumably also coincided with, or was preceded by, the evolution of a hydrophobic structured skin to successfully do so.

Our study was published in Journal of Experimental Biology. And thanks to Day’s Edge Productions, we also got the issue cover!

Reference

S. Baeckens, M. Temmerman, S. Gorb, C. Neto, M. Whiting & R. Van Damme (2021) Convergent evolution of skin surface microarchitecture and increased skin hydrophobicity in semi-aquatic anole lizards. Journal of Experimental Biology 224(19): jeb242939 (doi: 10.1242/jeb.242939)

Why Are There More Anoles Here?

New Paper: Disentangling Controls on Animal Abundance: Prey Availability, Thermal Habitat, and Microhabitat Structure

DOI:  https://doi.org/10.1002/ece3.7930

Above: Male Anolis bicaorum, endemic to the island of Utila (photo credit Tom Brown).

Why are there more anoles in this plot? This is the question that we continually asked ourselves whilst setting up our 2018 survey plots on the small island of Utila, Honduras, home of the endemic Anolis bicaorum (pictured above). So in 2019 we set out from Heathrow airport, kitted up with A LOT of equipment, for our second field season, based at Kanahau Utila Research and Conservation Facility, with one of the goals being to look into just that (see previous Anole Annals posts on Utila and its anoles).

Above Left: Getting ready to leave Heathrow (photo: Adam Algar). Above Right: Miraculously all the field kit all safely arrived at Houston stopover.

We all know that such factors as the thermal environment, prey resources and structural habitat play important roles in the lives of our beloved anoles. And we also know that you can go to one spot and be overrun with anoles, but go to a seemingly similar spot nearby and find none (usually when the field season is drawing to a close and you still don’t have a large enough sample size). But how are these aspects of anole biology linked? Specifically what determines their abundance, and its variation, at fine scales? While ecological niche theory is well developed, empirical evidence for which factors are most important, and how they interact, is still rare for many taxa, including anoles. Given rapid environmental change, understanding the drivers and mechanisms governing abundance is now more important than ever.

We measured the abundance of the endemic Anolis bicaorum across thirteen 20x20m plots along a tropical habitat gradient, using standard mark-recapture methods, based on Heckel & Roughgarden (1979). Within these plots, we also measured factors relating to the thermal habitat suitability (using 3D printed models fitted with iButtons), structural habitat (perch surveys), canopy cover (leaf area index) and prey availability (arthropod biomass and diversity). We then used N-mixture models and path analysis to disentangle direct and indirect effects of these factors on anole abundance.

Above Left: Emma setting up 3D printed anole thermal models. Above Right: Tom out collecting 3D printed anole replica models (photo credits Adam Algar).

We first decided on several measures for each niche factor which could determine the suitability of the habitat for the anoles. For the thermal environment, we first determined the thermal preference (Tpref) range of A. bicaorum, following Battles and Kolbe (2018). We then calculated two indices to quantify the thermal habitat quality of each plot. The first was the percent of model hours that operative temperatures (from 3D models) were within the Tpref range over the 36-hour study period for each plot. The second was the total number of degrees (°C) that the models deviated from the Tpref range across all models throughout the survey period for each plot, which included the total degrees, the degrees above and degrees below the Tpref range.

Above: Many of the anoles were “side-eye” pros

As a measure of structural microhabitat quality we determined both perch availability by counting surveys and the plot basal area (a measure of stand density), across all tree trunks, palm stems and fence posts in the plot.

Above:  A. bicaorum predating on an unidentified spider (Araneae).

For prey availability, we measured arthropod biomass (g) and diversity (Simpson and Shannon’s) from a combination of leaf litter sieving and sweep-net samples taken in each plot. Sweep-net and leaf-litter samples were combined for plot level analyses.

We also measured mean leaf area index (LAI) in each plot using an Accupar LP80 ceptometer. LAI is the one-sided area of leaves per unit ground area and is a measure of canopy density; it is expected to influence thermal environment via the interception of solar radiation (Campbell & Normal 1998; Algar et al 2018).

After we determined reasonable measures of habitat suitability for each factor, we examined univariate relationships between A. bicaorum abundance and each of our habitat variables (percent of time within Tpref, deviation from Tpref, perch number, basal area, arthropod biomass, arthropod diversity and LAI) by including each predictor as a covariate in a multinomial-Poisson mixture model of abundance. The results of the most significant and strongest relationships can be seen in the figure below.

Above: Relationships between Anolis bicaorum abundance and individual niche metrics in forest plots across Utila, Honduras. Relationships were estimated using multinomial Poisson mixture models with a constant detection rate across plots. All variables are scaled to a mean of zero and unit variance; (a) reflects thermal habitat quality, (b) reflects structural habitat quality, (c) reflects prey availability and (d) reflects canopy cover.

We used these models to select a subset of these variables (one representing habitat structure, one prey availability, and one thermal quality) for subsequent path analysis; we also included LAI as the sole measure for canopy cover. We used the path analysis to evaluate the relative strength of direct and indirect effects on abundance. As we could not estimate indirect paths within a single multinomial-Poisson mixture model, we estimated abundance for the path analysis from a multinomial Poisson mixture model that included no environmental covariates, held detection rate constant, and permitted abundance to vary by plot. The results of the path analysis can be seen in the figure below.

Above: Direct and indirect effects of niche axes on A. bicaorum abundance. (a) Values are standardized path coefficients; line width is proportional to the strength of the effect, solid lines indicate statistically significant pathways. ε, unexplained variation. (b) The total effects of covariates on abundance. NP: number of perches; PB: prey biomass; LAI: mean leaf area index; TP: time within Tpref range.

Our results showed that thermal habitat quality and prey biomass both had positive direct effects on anole abundance. However, thermal habitat quality also influenced prey biomass, leading to a strong indirect effect on abundance. Thermal habitat quality was primarily a function of canopy density, measured as leaf area index (LAI). Despite having little direct effect on abundance, LAI had a strong overall effect mediated by thermal quality and prey biomass.

We have demonstrated the interconnectedness of abiotic and biotic components that determine habitat quality and animal abundance. Rather than identify a single strong control on abundance, we found key abiotic factors (canopy cover and thermal environment) affect abundance through multiple pathways and have effects that are mediated by biotic interactions and the niche of the focal species. In particular, our results suggest alignment of thermal niches across multiple trophic levels results in strong indirect effects of thermal environment on anole abundance. Losses of thermal habitat quality, particularly due to canopy loss, may thus have greater effects than appreciated when only direct effects are considered.

Our results demonstrate the role of multidimensional environments and niche interactions in determining animal abundance and highlight the need to consider interactions between thermal niches and trophic interactions to understand variation in abundance, rather than focusing solely on changes in the physical environment. Identifying the factors responsible for population change along habitat gradients will improve our understanding of how multidimensional environments and niches interact to determine population abundance. Which is more important than ever in this ever-changing world.

You can read the full paper here.

If you have any questions or just an interest in the work, please feel free to contact me emma.a.higgins@hotmail.com.

I would also just like to thank everyone again who was involved in this project, it was a lot of hard work, but great fun and it couldn’t have been done without the team effort.

Above: Part of the field team, helping process what is certainly not an anole, whilst setting up survey plots (photo credit Adam Algar).


References

Algar, A.C. et al. 2018. Remote sensing restores predictability of ectotherm body temperature in the world’s forests. – Glob. Ecol. Biogeogr. 27: 1412-1425. https://doi.org/10.1111/geb.12811

Campbell, G. S., and J. M. Norman. 1998. An introduction to environmental biophysics. 2nd edition. -Springer-Verlag, New York.

Battles, A.C. and Kolbe, J.J. 2018. Miami heat: Urban heat islands influence the thermal suitability of habitats for ectotherms. – Glob. Change Biol. 25: 562–576. https://doi.org/10.1111/gcb.14509

Heckel, D.G. and Roughgarden, J., 1979. A Technique For estimating the Size of Lizard Populations .Published by : Wiley on behalf of the Ecological Society of America Stable URL : http://www.jstor.org/stable/1936865 References Linked refere 60, 966–975.


Insectivorous Bird Eats Anole!

Dominican House Wren (Troglodytes aedon rufescens) holding a juvenile Puerto Rican crested anole (Anolis cristatellus). Photo by M.P. van den Burg.

New literature alert!

Predation on the nonnative Puerto Rican crested anole (Anolis cristatellus) by the Dominican House Wren (Troglodytes aedon rufescens) on the Commonwealth of Dominica

In The Wilson Journal of Ornithology

van den Burg & Brisbane


Abstract

Predation on vertebrate species by insect-eating birds is rarely recorded, with only one report for the House Wren (Troglodytes aedon). On 4 January 2019, we observed a Dominican House Wren (T. a. rufescens) consume a juvenile of the nonnative Puerto Rican crested anole (Anolis cristatellus) in Roseau, Commonwealth of Dominica. This observation suggests the Dominican House Wren could additionally prey on the endemic Dominican anole (Anolis oculatus). This record aids our understanding of the ecosystem-wide impact of the A. cristatellus invasion.

Read the full article here, available as First Cite.

More Astonishing Parallels between Draco and Anolis

Despite being on opposite sides of the world and separated by millions of years of evolution, Draco and Anolis lizards have converged on many common adaptive solutions.

It has long been suspected that the Draco lizards of Southeast Asia were ecological analogues of the Anolis lizards in the Caribbean. But it has only been recently that we’ve started to truly figure out just how similar these two groups actually are. Especially exciting has been the discovery of how lizards in both groups have converged on remarkably similar adaptations: natural selection appears to repeat itself, time and time again.

The classic textbook scenario in anoles is adaptive convergence in ecomorphology, which reflects where lizards tend to hang out in the environment. This is particularly obvious  in the adaptation of Anolis limb morphology to different types of perches. I’m not sure we can say whether Draco exhibit the same ecomorphs as Caribbean anoles just yet, but Draco do exhibit the same adaptive changes in limb morphology as the anoles of the Caribbean.

Then there’s the obvious case of the dewlap, which has evolved separately in both Anolis and Draco as a key component of their territorial and courtship displays.

Most Anolis and Draco lizards also rely heavily on elaborate sequences of head-bobs in these displays as well.

This in itself isn’t unusual. Many lizards head-bob and push-up over territory and mates. Up to now, however, Caribbean Anolis lizards were the only ones known to tailor their display movements to ensure detection. For any visually communicating animal, visual “noise” from windblown vegetation and poor ambient light make it difficult to see visual signals. Anolis lizards were exceptional because they actively monitored environmental conditions and exaggerated their body movements when it was visually noisy (e.g., on windy days) or extended the duration of their displays when light levels diminished (e.g., on cloudy days or deep inside a forest).

There are a countless ways lizards might produce a conspicuous signal. Many Australian and Chinese lizards add arm-waves or elaborate tail-flicks or simply rely on colourful ornamentation that stands out well in the environment. Many North American lizards rely on performing lots of head-bobs or positioning themselves to accentuate a colourful badge on their throat or sides. But anoles seemed unique in both the complexity of their visual displays and their capacity to modify their behaviour to the prevailing conditions in the environment.

But after years of studying Anolis on Jamaica and Puerto Rico, and then even more years studying Draco in the Philippines, Borneo and Malaysia, we have now discovered more astonishing parallels between the two lizard groups that extends beyond just morphology.

Southeast Asian Draco lizards exhibit virtually identical strategies for coping with visually difficult environments as do the Caribbean Anolis lizards. Draco use the dewlap in the same way as the anoles, and change the speed (or exaggeration of movements) and the duration of displays in the same way as anoles, and this capacity to tailor displays to the conditions of the environment has also tended to precede what seems to have been adaptive divergences in display behaviour among species.

To discover all this, we had to study many different species of Draco and Anolis (11 and 12 species respectively), including hundreds and hundreds of lizards (727 to be precise), and then conduct thousands and thousands of hours of video analysis (13,310 hours – !!).

To be perfectly honest, what I was hoping to document from all this work was how differences in evolutionary history between the Anolis and Draco had shaped the trajectory of display evolution. Sure, Draco had evolved a dewlap like Anolis, but how that dewlap has been morphologically constructed was quite different between the two groups. I had become quite interested in these so-called “many-to-one, form-to-function” outcomes in evolution, and I was aiming to show something similar for display behaviour.

To be clear, there were differences in how Anolis and Draco lizards responded to environmental conditions, and how plastic changes in behaviour have contributed to display differentiation among species. In fact, the head-bob component of the territorial display has been entirely lost in some Draco species.

But the similarities were stunning and outweighed the differences by a large margin. Even the loss of headbobs in some Draco have intriguing similarities to how some Anolis species have shifted their display effort to the dewlap, which seems to be a more energetically efficient means of producing a conspicuous, complex visual display, than the more tiresome head-bob and push-up movements.

We have also confirmed experimentally in anoles that the manner in which Anolis lizards tailor their displays does actually improve display detection in visually difficult environments. This took a lot of work in itself and required the development of a robotic playback system, but this is now ancient history.

But to complete the loop, a similar type of playback experiment needed confirm the same adaptive benefit in Draco.

Some years ago we had conducted a lengthy field experiment using robot playbacks that were designed to test the response of Draco lizards to different coloured dewlaps. That experiment showed little effect of dewlap colour on detection, but a tangible effect that once lizards saw the dewlap, they used it to evaluate the species identity of the signaller.

I was in the lab one day looking at these old Draco robots to get some inspiration for designing a new system for some other crazy idea I had. As I was fiddling with the mechanism, I noticed that the robots weren’t exactly the same, with the lever controlling the dewlap of one being slightly longer than another. This meant the display probably differed in speed between the robots. These things happen and I didn’t think much of it at the time. The treatments used in the field experiment were systematically inter-changed across the robots to make sure this type of thing didn’t cause any problems.

Later, however, it occurred to me that perhaps this might offer a serendipitous opportunity to confirm the adaptive benefit of at least one of the key convergences exhibited by Draco lizards. I downloaded the data from the original study from its dryad repository, extracted the response times of lizards to the two robots that differed in dewlap speed, and sure enough, detection times were much quicker to the robot with the faster dewlap display.

The top panel (a) shows the differences in dewlap speed between the two robots, while the bottom panel (b) shows the detection time of free living Draco melanopogon.

If you’re interested in a short video introduction to this work, or want to know more about how these findings relate to our general understanding of adaptation and animal communication, you’ll find some answers in this 5 minute video below.

Ecomorphology of La Selva Anoles

Ever since the seminal papers by Williams and Rand [1,2], the Anolis radiation across the West Indies has increasingly established itself as an alluring example of ecomorphological convergence. Considering an Anolis community on one island, sympatric species have undergone niche partitioning, whereby each species has evolved particular behavioral, morphological, and ecological traits well-adapted for the microhabitat it occupies. Pop over to another island, and voilà, similar sets of ecomorphs can be found— their resemblance so striking and uncanny.

But the Anolis story isn’t clean cut. Studies of mainland anoles have yielded equivocal findings for whether they also conform to the beautiful patterns observed in the Caribbean. Much baseline data on mainland Anolis communities are needed to determine the extent to which convergence occurs and what factors drive differences in community structure. To partly address this gap, Jonathan Losos, Anthony Herrel, Ambika Kamath, and I recently published a paper describing the ecological morphology of anoles in a lowland tropical rainforest in Costa Rica, at La Selva Biological Station.

Accumulating field observations from four field seasons ranging from 2005 to 2017, we draw from over 1000 observations to characterize the habitat use of eight Anolis species that occur at La Selva. These species include Anolis humilis, Anolis limifrons, Anolis lemurinus, Anolis oxylophus, Anolis capito, Anolis carpenteri, Anolis biporcatus, and Anolis pentaprion, and we opted to devote a brief section to the co-occurring Polychrus gutturosus. Our results revealed overlapping niches and substantial variability in habitat use across many species. Furthermore, the morphologies of A. humilis and A. limifrons were at odds with microhabitat use following the predictions of Caribbean anole ecomorphology. Among the two most abundant species, relative hindlimb length was greater for the more arboreal A. limifrons, whereas it was shorter for the more terrestrial A. humilis.

If mainland and island anoles exhibit divergent ecomorphological patterns, this begs the question of how selective pressures differ between mainland and island habitats to drive these differences. Andrews [3] proposed that predation may more strongly influence Anolis diversification on the mainland, because in comparison to islands, predators are far more abundant, anole population densities are lower, and arthropod prey is plentiful. In contrast, Caribbean anoles are thought to be food limited and there may be stronger selection for niche partitioning. Through examining variation in species’ habitat use relative to the abundance of other co-occurring species at La Selva, our data suggests a low level of interspecific competition for this mainland community, corroborating the hypotheses Andrews set forth.

In recent years, the study of mainland anoles has received more attention. We are in great need of ecological, morphological, and life history trait data for Anolis communities throughout Central and South America to further our understanding of the evolutionary trajectories of mainland and island anoles. So, anole biologists, you can throw out your boats and steer clear of the oceanic divide!


[1] Rand, A. S., and E. E. Williams. 1969. The anoles of La Palma: aspects of their ecological relationships. Breviora 327:1–17.

[2] Williams, E. E. 1972. The origin of faunas. Evolution of lizard congeners in a complex island fauna: a trial analysis. Evolutionary Biology 6: 47–89.

[3] Andrews, R. M. 1979. Evolution of life histories: a comparison of Anolis lizards from matched island and mainland habitats. Breviora 454: 1–51.

Page 2 of 67

Powered by WordPress & Theme by Anders Norén