Several anole species are known from a single remote locality or only a few individuals, sometimes collected long ago. Because sampling these species is hard, we have a limited understanding about their biology and evolution. In a recent paper, we report on the rediscovery of Anolis nasofrontalis and Anolis pseudotigrinus, two mainland species from the Brazilian Atlantic Forest that were not reported for more than 40 years. Based on DNA sequence data, we examine their placement in the Anolis tree of life and estimate divergence times from their closest relatives. Moreover, based on the morphological attributes of newly and previously collected specimens (some of which were overlooked due to misidentification), we provide much needed taxonomic re-descriptions.

Coloration in life of Anolis nasofrontalis (A, B) and A. pseudotigrinus (C, D). In A, inset shows the black throat lining of A. nasofrontalis. Photographed specimens are females.
This study starts with efforts by collaborator Dr. Miguel T. Rodrigues (Universidade de São Paulo) to investigate reptiles and amphibians that have been undetected for years – a gap that could indicate human-driven extinctions. On late 2014, Dr. Rodrigues and his students (including co-author Mauro Teixeira Jr.) launched an expedition to the mountains of Santa Teresa (state of Espírito Santo, Brazil), the type locality of both A. nasofrontalis and A. pseudotigrinus. After a few days (and nights) of search, the team spotted the first A. pseudotigrinus in decades. The adult female was found sleeping on a narrow branch, (probably) unaware of its significance for South American biogeography (so were we). No signs, however, of A. nasofrontalis.
Shortly after, PhD students Paulo R. Melo-Sampaio (Museu Nacional) and Leandro O. Drummond (Universidade Federal do Rio de Janeiro) decided to visit Santa Teresa, inspired by conversations with Dr. Rodrigues. At this point, Dr. Rodrigues, my supervisor Dr. Ana C. Carnaval (City University of New York), and I had agreed that a phylogenetic study of A. pseudotigrinus would fit my PhD research well. Then, on early 2016, we got an unexpected email from Paulo and Leandro, with the first picture ever taken of an A. nasofrontalis in life. Both legendary anoles were real!
Back to the lab, we generated DNA sequence data and performed phylogenetic analyses, with completely unexpected results. First, A. nasofrontalis and A. pseudotigrinus are not closely related to the other (confirmed) Atlantic Forest species (A. fuscoauratus, A. ortonii, and A. punctatus); instead, they are close relatives of a species from western Amazonia, the “odd anole” Anolis dissimilis. These three species were found to compose a clade with A. calimae from the western cordillera of the Colombian Andes, A. neblininus from a Guiana Shield tepui on the Brazil-Venezuela border, and two undescribed Andean species (Anolis sp. R and Anolis sp. W from Poe et al. 2015 Copeia). This clade falls outside of the five major clades previously recovered within the Dactyloa radiation of Anolis, which have been referred to as species series (aequatorialis, heterodermus, latifrons, punctatus, roquet). Based on these results, we define the neblininus species series of Anolis.

Phylogenetic relationships and divergence times between species in the Dactyloa clade of Anolis inferred using BEAST. Asterisks denote posterior probabilities > 0.95.
The neblininus series is composed of narrowly-distributed species that occur in mid-elevation sites (or adjacent habitats in the case of A. dissimilis) separated by large geographic distances. This pattern suggests a complex biogeographic history involving former patches of suitable habitat between regions, followed by habitat retraction and extinction in the intervening areas. In the case of A. nasofrontalis and A. pseudotigrinus, for instance, past forest corridors may explain a close relationship with the western Amazonian A. dissimilis. Atlantic and Amazonian rainforests are presently separated by open savannas and shrublands, yet geochemical records suggest that former pulses of increased precipitation and wet forest expansion have favored intermittent connections between them. These connections may have also been favored by major landscape shifts as a result of Andean orogeny, such as the establishment of the Chapare buttress, a land bridge that connected the central Andes to the western edge of the Brazilian Shield during the Miocene.

Geographic distribution of confirmed and purported members of the neblininus species series. The inset presents a schematic map of South America around 10-12 mya, when the ancestor of A. nasofrontalis and A. pseudotigrinus diverged from its sister, the western Amazonian A. dissimilis. The approximate locality of the Chapare buttress, a land bridge that connected the central Andes to the western edge of the Brazilian Shield, is indicated.
During our morphological examinations of A. nasofrontalis and A. pseudotigrinus, it became apparent that these two species are not very different from Caribbean twig anoles, with whom they share short limbs and cryptic coloration. We learned that these features are also present in other, distantly-related mainland anoles, such as A. euskalerriari, A. orcesi, A. proboscis, and A. tigrinus. Phylogenetic relationships support that a twig anole-like phenotype was acquired (or lost) independently within Dactyloa, perhaps as a result of adaptive convergence. Alternatively, this pattern may reflect the conservation of an ancestral phenotype. In the former case, an apparent association with South American mountains is intriguing.
Unfortunately, natural history data from A. nasofrontalis and A. pseudotigrinus are lacking. It is currently unclear whether they exhibit the typical ecological and behavioral traits that characterize the Caribbean twig anole ecomorph, such as active foraging, slow movements, infrequent running or jumping, and preference for narrow perching surfaces.

Anolis dissimilis, the ‘odd anole’.
It has become increasingly clear that broader sampling of genetic variation is key to advance studies of mainland anole taxonomy and evolution. This significant challenge also provides exciting opportunities for complementary sampling efforts, exchange of information, and new collaborations between research groups working in different South American countries.
To learn more:
Prates I, Melo-Sampaio PR, Drummond LO, Teixeira Jr M, Rodrigues MT, Carnaval AC. 2017. Biogeographic links between southern Atlantic Forest and western South America: rediscovery, re-description, and phylogenetic relationships of two rare montane anole lizards from Brazil. Molecular Phylogenetics and Evolution, available online 11 May 2017.


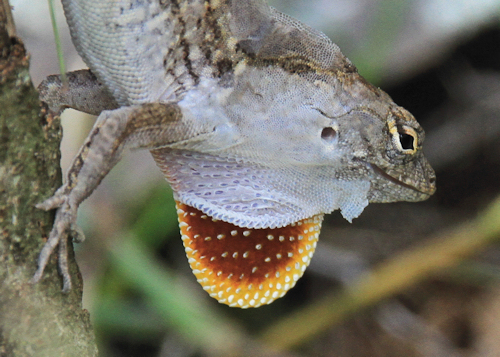
 Two male festive anoles (Anolis sagrei) fighting in Texas. From