Category: New Research Page 1 of 67

Peruvian Islands Foster Rapid Morphological Evolution in Introduced Lizards

As well exemplified by a significant fraction of anole research, islands can act as natural laboratories of evolution. With limited space, fewer predators, simplified communities, and isolation from the mainland, islands often impose strong and distinctive selective pressures relative to continental habitats. However, although anoles provide some of the most famous examples of evolution on islands, insularity can exert its effects on different types of organisms.

In our recent paper in Reptiles & Amphibians (Zamalloa-Bustinza et al. 2025), we focused on the Peruvian Lava Lizard (Microlophus peruvianus), a conspicuous and widespread species found along the South America’s western coast that was deliberately introduced to several offshore islands in the 1940s. These introductions were intended as a potential biological control for guano-bird ectoparasites. Despite the abundance and broad distribution of Microlophus, this island–mainland system has received surprisingly little attention. Taking advantage of this relatively recent introduction, we explored whether island populations show evidence of rapid morphological divergence from their continental counterparts.

To explore this, we compared adult lizards from a mainland population in northern Peru (San Pedro de Vice) with individuals from an insular population on Lobos de Tierra Island. Rather than focusing on a single trait, we examined a suite of ecologically relevant morphological characters, including body size, head dimensions, and limb proportions, traits known to be tightly linked to feeding and locomotion in lizards.

After less than a century of isolation, island and mainland populations showed clear and consistent morphological differences. Island lizards were larger overall and had relatively longer limb elements and interlimb distances. In contrast, mainland individuals tended to have proportionally larger and taller heads, as well as longer fingers, toes, and femora.

These differences might be pointing to subtle but meaningful shifts in ecomorphology. The evolution of relatively larger heads and longer digits in mainland lizards may reflect the demands of exploiting a more diverse prey base and moving through open habitats where predators and competitors are present. On islands, larger body size may be favored under conditions of reduced predation, while longer forelimbs may be associated with the use of different microhabitats when compared to mainland populations.

Together, our results suggest that morphological differences between island and mainland populations can emerge rapidly following introduction. However, further research is needed to link morphological divergence to ecological causes, if any. Ongoing work is expanding this approach to additional islands along the Peruvian coast and to other aspects of the phenotype, including behavior. These efforts will help determine whether the morphological patterns observed here are consistent across the species’ broad geographic range and how closely they align with ecological differences among localities.

Zamalloa-Bustinza, D., Burga-Castillo, M., Perez, J., Quispitúpac, E., & Toyama, K. S. (2025). Rapid ecomorphological divergence between island and mainland populations of the Peruvian Lava Lizard (Microlophus peruvianus) in Northern Peru. Reptiles & Amphibians, 32(1), e22961-e22961.

Color-changing Females: Just Blending in or Born to Stand Out??

Across the Anolis genus, color and color change are used in a variety of ways, from camouflage to signaling. While many studies have focused on male coloration, few have explored the more subtle females and the role that their coloration may play. We sought to continue to understand the role of rapid color change in Anolis aquaticus (the water anole). Previous work within the species has discovered that color change is used as camouflage and that males are more consistent at matching their background coloration than females. However, whether color change could also be used as a social signal had yet to be tested. Therefore, we wanted to further test if color change may also be used as a social signal, specifically in females.

In the lab, we exposed female lizards to a dark enclosed tank to darken their coloration (these lizards experience rapid-color lightening) and then immediately placed them in an arena with a male conspecific. We repeated this with an empty tank as well for each lizard to compare both a social and isolated color change. To determine the extent of color change, we photographed their coloration before and after each trial. Using MicaToolbox in ImageJ, we created a visual model based on the brown anole visual system to get a better look into what these anoles look like to each other.

We discovered that while color did change during each trial, there was not a significant difference between social and isolated trials. However, we did find that females that had better body condition had bluer and less green coloration as compared to those with lower condition. We propose a few directions toward which these results may be pointing . First, this shift away from green and toward blue seems to be a less camouflaged color and therefore may indicate that greater body conditioned individuals don’t camouflage as much as smaller lizards. This would also coincide with previous findings that females are more conspicuous in the field than males. These findings may also lead to the idea that females are using this coloration to signal quality to potential mates and that coloration is indicative of health in the species.

Relationships of Anolis aquaticus body stripe x-mean values (green-to-red axis; A) and y-mean values (blue-to-yellow axis; B) in relationship to body condition. Colored bands represent 95% confidence intervals for the predicted regression lines.Body stripe x-mean colour values (green-to-red axis; A) and y-mean colour values (blue-to-yellow axis; B) of water anoles (Anolis aquaticus) before and after trials.

Ultimately, our study shows the importance of continuing to explore drivers of color change in the genus, and to broaden our studies to include or highlight female coloration in not only Anolis but across taxa.

Check out more details of our findings in our paper out now in Biological Journal of the Linnean Society.


Changing Gears (and Colors): Investigating Color Change in Green Anoles Using Computer Vision

Green anoles (Anolis carolinensis), also described as the American chameleon, can change between brown and green coloration at will in a process known as physiological color change. Deciphering the adaptive purpose of this ability has captured scientists for over a century, with three major hypotheses dominating research: camouflage, social signaling, and thermoregulation. Social signaling is the most well-supported explanation in recent literature, while camouflage has lacked evidence. However, thermoregulation has remained contentious, as older studies show strong support for the hypothesis while newer studies show weak or no support. Seeing this disconnect, my coauthors (Robert Guralnick, Coleman Sheehy III, and Jacob Idec) and I attempted to evaluate these three hypotheses through a novel method to provide fresh insights into what drives color change in Anolis carolinensis.

Diagram of the computer vision pipeline

In our recent paper, we harness over 10,000 images from iNaturalist and recent advances in computer vision technology to evaluate the support for each of these hypotheses at a large scale. To determine the color of the anole in each observation, we utilized Meta’s new SegmentAnything Model (SAM) to generate segments of the anole in the image, filtered out poor segments, and then used a simple equation to determine whether the anole was presenting green or brown. Then, by using the metadata attached to community science posts, we were able to retrieve the exact date-time and estimate the temperature at the moment of image capture. Using these data, we found a strong correlation between the proportion of anoles observed as brown and lower temperatures. Interestingly, during the summer breeding season, this correlation completely disappeared. Additionally, the difference in proportions of green and brown presentation throughout the year was strongly linked to latitude. These observations combined provide evidence for both the thermoregulatory hypothesis and the social signaling hypothesis, which suggests multiple adaptive drivers of color change in this species.


Although big-data observational studies such as this are insufficient to prove the ultimate cause of physiological color change in green anoles, we believe that this paper can serve as a guide for future research that takes time of year and location into account when testing these hypotheses. Furthermore, this research shows that community science has immense potential in big-data studies, especially when working in tandem with artificial intelligence systems such as computer vision. Therefore, we must thank all of the spectacular citizen scientists on iNaturalist to thank for this amazing project, and we hope that more scientists take advantage of the breadth of data available from our communities.

If you would like to read the entirety of this paper, it can be read for free at this link: https://rdcu.be/eMrgE

Non-native Herps Still Increasing in the Most Heavily Invaded Herp Community in the World.

A large green lizard in the foreground perched on a tree, with an open grassy area behind and a natural area in the distance.

Anolis equestris during one of our Miami surveys

There truly is never a dull moment in South Florida, especially for those of us who love herps. South Florida is a herper’s paradise with at least 63 exotic herps recorded in the state in addition to some unique and endemic native species. In fact, South Florida is the global hotspot for non-native herps, and the world’s most invaded continental ecoregion. While almost all the herps we see while walking around Miami are non-native, we are also almost always in heavily human-modified habitat. This led us to wonder if we would see more native species if we were at sites where native habitat was preserved. Back in 2017, we set out to answer this question, comparing herp communities between 15 parks with natural habitats and 15 parks with primarily anthropogenic features (think playgrounds, baseball fields, and dog parks). Spoiler alert: Non-native species dominated the herp communities in all of the parks, natural and anthropogenic alike. Non-natives made up a whopping 90.6% of all individuals we identified. Perhaps unsurprisingly for those who have grown accustomed to the small lizards scurrying along their sidewalks and fences, 86% of everything we saw was from the genus Anolis.

Fast forward to 5 years later. It’s 2022 and all of us herpetologists in Miami are constantly being asked by anyone who learns of our lizard expertise, “What’s this big new lizard I keep seeing?! It’s got an orange head and tail and a blue body,” or “I keep seeing these lizards with curly tails hanging out around my house – what are they?” These two large predatory lizards, agamas and curlytails, are clearly spreading around the county, to the point where even non-lizard-people are taking note. As we look around, we can’t help but wonder if there could be a change in the composition of our already very exotic herp community in Miami in just the 5 years that have passed since our former study. So, we set out to answer that question.

Several months later we’d completed the same surveys at the same 30 parks, with a fantastic team of researchers, exactly five years after our first study. What did we find? Well, despite both the incredibly short time span and South Florida already being the most invaded herpetofauna community in the world, we found that non-native herps were still increasing in both richness and abundance, in amounts that were measurable in just a 5-year period! Non-native herp abundance increased significantly by 32.7%, while native abundance did not change significantly (only a 6% increase). This time around, 92.3% of our observations were non-native herps. Once again, most of our observed individuals were anoles (82%), and brown anoles and green anoles were our most commonly observed species, both being found at 97% of all sites surveyed. It is worth mentioning, however, that even the 7.7% of observations that were classified as “native” have a caveat: Most of these observations were Anolis carolinensis. As readers of Anole Annals likely know, there is now evidence that most Anolis carolinensis in Miami are hybrids with the non-native Anolis porcatus. If these are reclassified as non-native, our native count is down to just ~1%.

Figure caption: Bar graphs showing the difference in mean (a) abundance and (b) richness (±95% Confidence intervals) by year. Total abundance (p = 0.043) and richness (p = 0.001), as well as non-native abundance (p = 0.032) and richness (p = 0.0012), increased significantly from 2017 to 2022, whereas native abundance and richness did not (p > 0.4).

While Anolis spp. make up most of our observations, it was really the agamas and curlytails that stole the show this time around.

Limited Morphological Differences of Brown Anoles (Anolis sagrei) between Their Native Cuban and Invasive Florida Range

Jars containing museum specimens are on a cart next to the shelf.

The ubiquity of Brown Anoles (Anolis sagrei) in Florida means that they are constantly on my mind. Given the proposition that rapid evolution may be important to invasive species success, I was curious to determine if invasive Brown Anoles in the southeastern United States, centered in Florida, have any morphological differences from Brown Anoles in their native range in Cuba. To address this question, I measured museum specimens to compare Brown Anole morphology between their invasive and native range and “go back in time” to see if Brown Anole morphology has changed since their invasion.

As reported in our recent paper, Brown Anoles have broadly similar morphology between their native Cuban and invasive Florida ranges. Additionally, we found no clear evidence of the measured morphological traits changing over time. These results suggest that rapid morphological evolution may not be essential to the success of invasive Brown Anoles.

Abstract:

Understanding why some species and not others are successful global invaders is an important question in ecology and evolutionary biology. There is much debate on the role that rapid post-invasion adaptation plays in the success of invasive species. Here, we investigated signals of rapid and broad-scale morphological evolution in Anolis sagrei (Brown Anole) between their invasive and native distributions. Although we found significant differences in a few morphological characters between invasive and native Brown Anoles, the morphological variation present in the species broadly overlapped between both populations and has not significantly changed over the last century. These results suggest the invasive success of Brown Anoles in Florida may not be due to major evolutionary change from their Cuban ancestors.

Mapping Anole Operative Temperature with Unoccupied Aerial Vehicles (UAVs)

Left: Emma setting up the 3D Anolis replicas (excuse the yoga clothes–it was hot!), Right: 3D replica in-situ.

A lot of us have been there…. setting up what seems like endless 3D anole replicas, often in the tropical heat, messing around with countless iButtons (which are a nightmare to get out of the replicas), to measure operative temperature (Te)–the temperature of the animal at equilibrium with its environment….

As frustrating as this can sometimes be, it is an integral part of measuring thermal habitat quality and availability, which as we all know, is important for such things as ectotherm energetics, abundance and predicting species responses to climate and land cover change.

However, using these 3D replicas, we only get point-based measures of Te at randomly selected points within the survey area. These points are sampling only a very small extent of thermal habitat, and therefore may not represent the conditions mere metres away.  This method therefore does not allow us to measure Te across the whole of the survey area at spatial resolutions relevant to the individual animal. This method is also, costly in terms of both time and money. Therefore, is there another way?

Well, we do have microclimate–biophysical modelling, which generally relies on mechanistic models that downscale broad scale (usually monthly) macro-climate (≥ 1km grid) data to estimate microclimate in specific habitats, e.g.  NicheMapR, Microclima and Microclimc (Kearney and Porter, 2017; Maclean et al., 2018; Maclean and Klinges, 2021). These estimates of microclimate must then be combined with biophysical heat exchange models to estimate animal operative temperature (Te), e.g. the ectotherm model in NicheMapR (Kearney and Porter, 2020).

These models have revolutionized our ability to model thermal environments across broad spatial extents, especially for species distribution modelling, and new developments have the potential to model much finer variation (e.g. Microclimc), but applications at scales of individual organismal movement (e.g. cms to m) are still rare.

These limitations of existing methods are particularly pertinent given the established importance of spatial heterogeneity of thermal environment for species, particularly ectotherms, and by extension our beloved anoles (Huey, 1974; Sears and Angiletta, 2015; Sears et al., 2016).

Luckily, we as a team had already pondered, if the canopy is key for regulating ectotherm operative temperatures (Te), then, can we predict Te using biophysical equations relating to canopy characteristics?

Part of the field team, helping process what is certainly not an anole, whilst setting up survey plots (photo credit Adam Algar).

This was the basis of this paper, “Unoccupied Aerial Vehicles as a Tool to Map Lizard Operative Temperature in Tropical Environments.”

So, to test this, we first needed to collect canopy data – which, for anyone who has done this type of work will agree, is not so easy! This is where Unoccupied Aerial Vehicles (UAVs) come in.

Dewlap Displays Supersede Headbobs, Yet Again

The dewlap is probably the most noticeable thing about anoles. For me, the best way to spot an anole is by the flash of color from the dewlap as a lizard displays. Without that, many anoles would remain cryptic amongst the vegetation. This seems to be the case for the lizards themselves as well. The burst of color and movement as the dewlap is rapidly extended is a wonderful device for attracting the attention of rivals and mates. It’s possible that the dewlap originally evolved as an attention-grabbing flag to augment an existing sequence of elaborate headbob movements in forested environments. These days, the dewlap is a complex signal component in its own right, often with a dizzying array of colours and displayed using a variety of movements.

Anoles aren’t the only ones with a moveable dewlap. The Southeast Asian Draco lizards have a dewlap, and again to back up the headbob movements that make up their main channel of social communication. There are many other parallels between Draco and Anolis lizards, but the similarities in how they communicate is something that particularly fascinates me.

Early on in my fieldwork with Draco, I started discovering species that didn’t seem to use headbobs as part of their social display. It seemed these species had lost the headbob entirely and instead concentrated all of their communication through the dewlap display. These species are a minority, but not by much. It was a puzzle. These Draco had lost a central and complex element of their communication in favour of something that was seemingly more basic. Communication biologists are often fixated on trying to explain how animal communication becomes more elaborate over evolutionary time, but less attentive to why complexity subsequently becomes lost. These Draco lizards were an excellent case study.

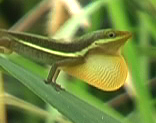
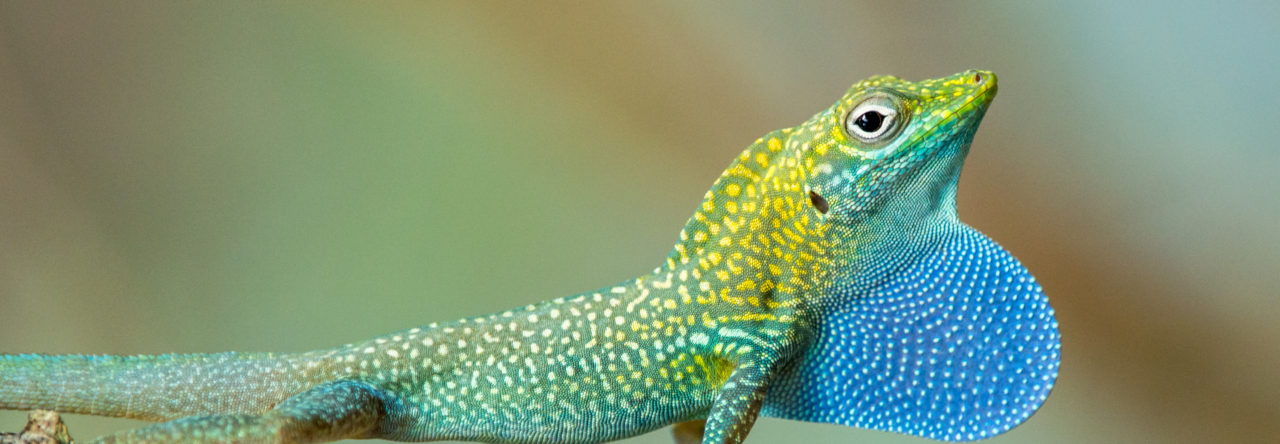
Draco melanopogon (photo above) only communicates using the dewlap, whereas Draco sumatranus (opening banner photo) relies on both headbobs and the dewlap, just like anoles.

After nearly a decade of fieldwork on numerous species of Draco throughout Malaysia, Borneo and the Philippines, my trips stalled in 2020, as did the rest of the world. Celebrities had nothing better to do than write biographies, but my lockdown project was to focus on using the data I already had at hand to finally solve the curious case of the missing headbob.

It felt like an endless series of stay-at-home orders in Australia, and well into 2021 too. While the celebrities had gone on to finish their books and were now doing the zoom promotion circuit, my progress was hurdled by home-schooling two young children. We survived home-schooling in the end, and my attempt at figuring out why some Draco have lost the headbob has finally been published.

The evolutionary history of visual displays in agamid lizards

The first discovery is the headbob display is very ancient, evolving something like 130 million years ago or more. That’s before the evolution of Draco, and before the evolution of the anoles, in an evolutionary ancestor to both the iguanid (new world) and agamid (old world) lizard families. This was back in the age of the dinosaurs. Today, virtually all iguanid and agamid lizards use a headbob display or some variant of it in social communication. Which means the absence of the headbob in a handful of Draco species is very unusual.

The loss of the headbob from the social display of Draco is effectively a loss of complexity. A loss of complexity means a loss of “information potential.” Try writing a biography with half the alphabet. You might manage the following or something a little longer: “I was born. I paid taxes.” Thirteen unique letters in total. Obviously not the rich backstory you might hope for. Not because you hadn’t lived a fulfilling existence; rather you don’t have the language complexity to convey it in detail.

There are various reasons animals might lose complexity in their social signals. Perhaps the original need for a complex signal is no longer present. Perhaps the invasion of a new environment puts a brake on the level of complexity that can be accurately perceived. Or perhaps natural selection on other things, like body size, has made performing a complex signal too costly.

The beauty of having spent so much time in the field is the accumulation of a large library of data. By leveraging this information, I was able to test each of the above scenarios. The short of it is, Draco that have lost the headbob are unusually large species. Physically moving the head and body in a headbob display is more energetically expensive than pumping the dewlap in and out. It seems, then, that the physiological cost of performing the headbob became too great for these large species and they shifted to relying only on the dewlap for communication. This implies the communication system of these species is compromised, unless they have made up the loss of information potential somewhere else.

Draco without the headbob have more complex dewlap colour patterns. Each dot is a different species.

In fact, the dewlap itself tends to be more complex in Draco that have lost the headbob. Stealing a method for measuring complexity of anole displays, the dewlap of these Draco are more elaborately coloured than the average Draco. Unfortunately, this is unlikely to have been enough to fully cover the loss of the headbob. This means Draco that no longer use the headbob are relying on a constrained communication system.

The idea that the headbob is likely to be more energetically expensive than the dewlap was originally proposed for the anoles. It was used to explain the physiological basis for why Jamaican anoles might have evolved an innovation that allowed them to move away from a headbob-centred display in favour of one focussed on the dewlap. To be clear, the Jamaican anoles do still rely on headbobs in their social displays. But a rapid series of dewlap pumps features more prominently in their displays compared to the typical anole, like those on Puerto Rico for example.

It seems the dewlap has begun to supersede the headbob in anoles as well.

If you’d rather not slog through the paper itself, you can view a 12 minute video summary instead. If you would like to slog through the paper and can’t access it behind the paywall, drop me an email and I’ll forward you a free copy (t.ord@unsw.edu.au).

Parallel Urban Adaptation from Phenotype to Genotype in Anolis Lizards

Anoles are models for studying evolution in the wild. Not only do anoles have a history of repeatedly diversifying to specialize in the same types of microhabitats in the same ways across the Greater Antilles, these lizards also have a tendency to adapt on rapid timescales to environmental change — be it the addition or subtraction of a predator or competitor, a polar vortex, a change to the structural environment, or a hurricane.

Anoles are also models for urban evolution. Why? Anoles are found abundantly across the Caribbean in urban and forest environments where they specialize in divergent microenvironments characterized by shifts in climate and physical structure. Urban habitats tend to be warmer, drier, more open, and dominated by buildings and impervious surfaces instead of vegetation — providing the perfect opportunity for repeated adaptation to a novel combination of environmental conditions. In other words, Caribbean cities provide a replicated natural laboratory to study adaptation as it happens when these lizards colonize and thrive in urbanizing areas. And there is no shortage of urban-tolerant and urbanophilic anole species to choose from!

Species of Anolis lizards are found in urban environments across the Caribbean (photos CC-BY K. Winchell; Earth at night by NASA).

Island Colonization, Drought, and Competition in Panama

You open your eyes, blinking away water, you’re on a beach you don’t recognise, and never set out to visit. You look up and along the coast, it’s an island, the flora is alien to you, the climate hotter, and you’re already sweating. An eldritch cry emanates from the forest near you, new wildlife, things you have never seen before skulk around beyond the vines that lay before you.

Lifting yourself up, you decide to escape the blazing sun. You leave the beach and push through the wall of vegetation that veils the forest from the beach. You expect it to be cooler, but it isn’t. The forest is completely new to you, as you move through the undergrowth, unfamiliar insects dart away, flying past plants you’ve never seen before. As you press on through the undergrowth you wonder how long you will have to spend here? How much more time do you have here?

Dewlap Size Is Not What We Thought

The large, colourful dewlap is an obvious defining characteristic of the anole. Understandably, then, there has been a lot of investigation (and speculation) on what the dewlap is used for. Without doubt it’s for social communication, but to communicate what. Historically, the dewlap was thought to be used for species recognition, which remains a reasonable explanation today. But a typical assumption made by many anole researchers and evolutionary ecologists alike is the dewlap, and specifically its size, is effectively an ornament used to attract mates or advertise potential fighting ability among territorial rivals. In other words, the evolution of the dewlap is the product of sexual selection.

If that’s the case, then dewlap size should be linked to some aspect of an individual’s ‘quality’ or physical condition, especially in males who seem to be the ones courting females (not vice versa) or defending territories. This is because a male’s quality or condition can be hard to assess by general appearance alone, unless there is a key feature that provides an honest indicator of that quality. In anoles, this is assumed to be a large dewlap that’s physiologically costly to produce.

One easy way that has been proposed to test for sexual selection in the origin of a morphological structure like the dewlap, is to look how it scales with body size. Structures that are honest indicators of condition will be costly to develop and maintain. Large males are often in better condition than small males because of the underlying factors that result in bigger bodies (e.g., a history of successful foraging, superior growth rate, having ‘good’ genes). This means larger males can invest more in exaggerating the size of the dewlap than smaller males. There would be a clear evolutionary incentive to do so as well, because having a larger dewlap would attract more mates and appear more threatening to male rivals. The outcome of this should be disproportionately larger dewlaps in larger males. This is called positive allometry or hyper-allometry. If dewlap size has a hyper-allometric scaling relationship with body size, then it probably resulted from sexual selection. Or at least that’s the idea. And you can find this out by just measuring a bunch a males.

The dewlap of anoles featured heavily in the original formulation of this idea, with the conclusion being that dewlap size was hyper-allometric and assumed to be the product of sexual selection. Anoles have therefore become a classic example of how sexual selection drives hyper-allometric scaling in ornament size.

Tom Summers

Tom Summers was a graduate student who thought about hyper-allometric scaling a lot. He looked at the scaling relationship of ornaments that he had confirmed experimentally to be the target of sexual selection in fish, and found they were hyper-allometric…sometimes. Tom found natural selection on ornament size can often work in the opposite direction to sexual selection. This is because large ornaments can interfere with locomotion and often be conspicuous targets for predators. When these pressures are high, species tend not to show hyper-allometry in ornaments. Those ornaments were still the product of sexual selection, but their allometric scaling was dampened by opposing natural selection.

Tom turned this attention to the anoles, and found overwhelmingly that dewlap size was not hyper-allometric but hypo-allometric. That is, larger males have disproportionately smaller dewlaps than smaller males. He even looked at another group of lizards that have independently evolved a dewlap, the southeast Asian Draco, and found the same pattern. His results have just been published in the Journal of Evolutionary Biology.

The scaling relationship of the dewlap in both groups varied from one species to another, but never was it hyper-allometric. In the case of the anole dewlap, this variation in dewlap size was predicted by factors important in signal detection (receiver distance and habitat light). This was consistent with the general hypo-allometry of the dewlap as well.

The effectiveness of a visual flag (like the dewlap) in attracting the attention of a receiver (another lizard) is dependent on the gross size of that flag, not how big it is relative to the signaller’s body (i.e., allometric scaling is irrelevant). Beyond a particular threshold size, which is dependent on the visual acuity of the animal in question, there are diminishing returns for detection with increasing size. Even a large increase in dewlap size beyond a certain point wouldn’t really improve signal detection, a phenomenon known as ‘Weber’s Law’. The resulting pattern when comparing dewlap size among males is hypo-allometric scaling. Larger males have generally reached the size threshold for reliable detection, so there’s little point in further elaboration.

It also fits with the extensive amount of work showing that the dewlap is likely to be most important in signal detection, rather than a cue of quality.

So why such a dramatically different finding to earlier investigations of the anole dewlap? All studies prior to Tom’s measured dewlap size by catching the lizard and manually pulling out the dewlap using forceps. Simon Lailvaux has discovered that the skin of the dewlap varies in its elasticity. Larger dewlaps are going to be more stretchy than smaller dewlaps. This means you can probably pull the dewlap out to a larger size in larger males. This would subsequently generate the artifact of hyper-allometric scaling when comparing dewlap size across males of different size.

Tom had measured dewlap size from high-definition videos of free-ranging males fully extending their dewlaps during display. There are various analyses in his paper that confirm this approach provides an accurate measure of dewlap size. His logic at the time was this view of the dewlap would be how lizards actually see and evaluate the size of the dewlap relative to body size. It also meant animals didn’t have to be caught, so the approach was less intrusive for the animal (always a plus). It just happened he avoided the potential problem of over stretching the dewlap if he had caught the animals and manually extended the dewlap by hand.

What does this mean for all that data that has been based on researchers pulling out the dewlap using forceps to measure its size? Honestly, I don’t know. Maybe nothing depending on what the data are being used for. Maybe everything if the data are being used in allometry studies.

Page 1 of 67

Powered by WordPress & Theme by Anders Norén