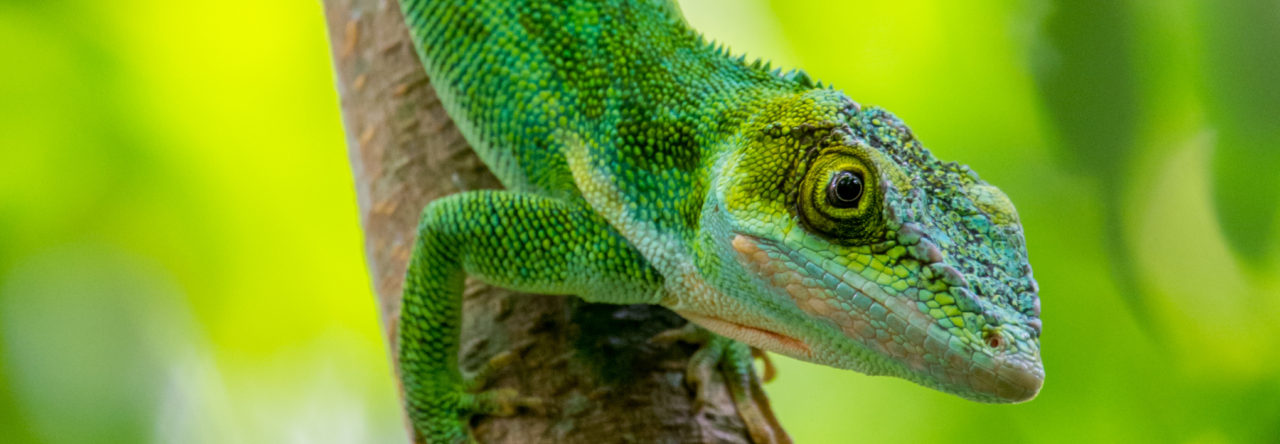

A male A. distichus favillarum (a.k.a. a male Fav) extending it’s dewlap. This animal was photographed in the contact zone between orange- and yellow-dewlapped Favs.
Color and color-pattern research is a powerhouse in the study of evolution. Don’t believe me? I bet that at least one of your top five examples of evolution includes either color or color pattern. It is also very likely that some of the gene names you know by heart are from either color or color-pattern genes. Here’s an exercise: think which were the ‘textbook’ examples of evolution that you were taught in school. I’m sure that at least one of those included either color or color pattern. Here’s a famous example: Peppered moths. Another one? Deer mice. Another one? Heliconius butterflies. Another one? Coral snakes. What about color genes? Does MC1R ring a bell? Another one? ASIP (a.k.a. agouti)? Another one? Well, I should stop here before DJ Khaled sues me for copyright infringement.
Most of these early studies, however – and specially studies that attempted to unveil the genetic basis of color and color pattern – focused on melanin-based traits. The reason for this bias was simple: human color is melanin-based. This means that when these early studies took place, we knew more about the genetic basis of melanin synthesis than any other pigment by a long shot. As a consequence, melanin-based traits were ideal for candidate gene approaches – like the ones implemented in early color and color-pattern studies. As you and I know, though, the world isn’t black and white (see what I did here?). Color is all around us, and it plays all kinds of amazing roles, such as intra-specific communication (think dewlapping anoles), inter-specific communication (think dewlapping anoles), and crypsis (think non-dewlapping anoles). This means that, until recently, we didn’t have the tools to connect the genetic basis of most colorful traits to their phenotypes, specially in non-model organsisms.
Then, something happened: second generation sequencing came around. Illumina, a key player in second generation sequencing, was founded in 1998, the same year that Brazil lost the World Cup Final to France (many Brazilians, like me, think about time in four-year cycles due to the World Cup… and we don’t talk about 2014). With second generation sequencing, we could finally gather loads of data to do all kinds of glorified regressions (sorry generalized linear mixed models), and run computers for very long times so that we could try every feasible parameter combination (sorry Markov Chains) to identify candidate genes for the trait we are interested in. Connecting genotypes to phenotypes and understanding how both genotypes and phenotypes interact and change due to selection is, in fact, one of my main research interests.
I’m particularly interested in understanding the genetic basis of two phenotypes: those associated with color and color pattern, and those associated with the evolution of reproductive isolation. I’d be more than happy to talk about my other research interests, such as the evolution of reproductive isolation or the dynamics of neo-sex chromosomes in anoles, so feel free to e-mail me if you have any questions about those. However, in this post I’ll talk to you about a paper on the former that Rich Glor, Paul Hime, and I recently published in GBE. In this manuscript we took the first steps to identifying the genetic basis of color and color pattern in anoles. Identifying candidate genes, however, is just the tip of the iceberg.
What do we Know About Color and Color-Pattern?
For starters, I want to explain why I always refer to color and color pattern as separate ‘entities.’ This is because the genetic basis of color is not exactly the same as that of color pattern. Confusing? If so, let me try to explain. What this means is that the genes that determine whether an organism will have spots or stripes are different from the genes that determine which colors those spots and stripes will be. That makes sense, right? Please do note that these two gene sets are not completely independent; only specific cells, called chromatophores, either produce or deposit pigments across most vertebrates. This means that the sets of genes that are responsible for the development, migration, and maintenance of these chromatophores differ from the set of genes responsible for the production of pigments like, say, carotenoids (check out the scheme below to get a broad idea of what I’m talking about).
This only partial overlap between color and color-pattern gene sets is why you see some of those washed-out ball python color morphs. Some of these morphs still have both chromatophores in their dermis (typically light-absorbing melanophores overlaid by pigment-bearing xanthophores), but their melanophores are not able to synthesize eumelanin (FYI: as far as we know, squamates don’t synthesize phaeomelanin). This means that in these ball python morphs the xanthophores, which still have their yellow pigments, overlay melanin-less melanophores, producing those “washed-out” yellow-ish phenotypes. The implication of this partial independence of color and color pattern is that the trait we all loosely refer to as ‘color’ is determined by not one or two, but multiple gene sets, making color and color pattern even more complex and interesting!

Fig. 1 Schematic representation of the hypothesized genetic determinants for color and color pattern in the Glowing Ember Trunk Anole (Anolis distichus favillarum). All three types of dermal chromatophores originate through the migration and differentiation of neural crest cells. Arrows connecting the neural crest cells to each chromatophore represent genes responsible for chromatophore differentiation in zebrafish. Arrows connecting BNC2 to chromatophores indicate that BNC2 is produced by surrounding cells rather than chromatophores themselves. The genes we found to be differentially expressed are underlined. Inset ‘a.’ depicts the hypothesized negative-feedback mechanism for carotenoid influx regulation we based on recent findings in mice; this inset also illustrates the two candidate genes for ketolation we identified in A. distichus. Once dietary xanthophylls are scavenged from the blood by SCARB1 they can either be broken down by BCO1 and used in the synthesis of retinoic acid products (RAR/RXR), directly deposited in lipid vesicles, or potentially ketolated by either CYP2J2 or CYP2J6. Our expression data suggests that erythrophores could hold both ketocarotenoids and drosopterins. Insets ‘i’, ‘ii’ and ‘iii’ represent the expected composition of chromatophore units in yellow, orange and white skin, respectively. Given our differential expression results, we expect orange skin to have more melanophores and erythrophores per unit area than yellow skin, and white skin to have more iridophores per unit area than pigmented skin. At the bottom of the figure we present a table with the predicted and observed gene expression patterns for each skin comparison.
What did we Do?
We are now ready to move on to the research. What was the question that we set out to answer in our publication? In a nutshell, we wanted to know two things. First, do differences in phenotype between patches of skin with distinct colors correlate with differences in gene expression? Second, could we tell if the genetic basis of color and color pattern in squamates is similar to what has been described in other vertebrates?
To answer these questions, I focused on Anolis distichus, the Hispaniolan Bark Anole (check out the handsome fellow at the beginning of the manuscript). This is hands down the coolest anole. No contest here. No need to comment below with pictures of your favorite anoles to try to convince me otherwise. The reasons for its awesomeness are manifold, but amongst them is their dewlap color polymorphism. I’m fairly sure everybody that’s reading this very niche post knows what a dewlap is, but just in case you’re new to all this (welcome!), dewlaps are the flappy thingies that typically male anoles extend to communicate.
Back when Schwartz described the A. distichus group, the biological species concept was, as kids today would say, “gas” (from the Urban Dictionary: Gas – Used to indicate something is cool, interchangeable with fire, dope, sick, etc.). Schwartz noticed that even though this bark anole showed considerable geographical dewlap color polymorphism, these phenotypically distinct populations were still able to reproduce when they came in contact in narrow contact zones. The evidence for gene flow between phenotypically distinct populations prevented Schwartz to go full splitter mode. Schwartz kept most phenotypically distinct populations as a single species, and described populations with distinctive meristic characters and dewlap colors as their own subspecies, with one exception: Anolis distichus favillarum, a.k.a. the Glowing Ember Trunk Anole – named after some redness they have on the side of their heads, – a.k.a. Favs (for short).
Evidence for gene flow between phenotypically distinct Fav populations was so wild that Schwartz kept them as a single subspecies, despite populations from the dry lowlands in Barahona having yellow dewlaps and those from the wetter Cordillera having orange dewlaps! Research by the Glor lab (shout out to Anthony, Julienne and Daniel) later confirmed many of Schwartz’s observations, including that there’s little evidence for genetic structure across phenotypically distinct Favs. If you are interested in genotype-to-phenotype associations, this should warm your heart. Population structure is a pain to deal with in genotype-to-phenotype association studies as they inflate the number of false positive results. Having a population that shows distinct phenotypes despite gene flow helps account for this issue, and makes a lot of the downstream genomic and transcriptomic analyses easier to deal with. As a consequence, I picked Favs as the group of A. distichus that I’d use to answer my color and color-pattern questions.
Now, how does one link genotype to phenotype in wild populations? The answer is: not easily. Usually this endeavor takes many different analyses just to identify candidate genes. Once you find those candidates, you still have to do a bunch more analyses to confirm that your candidates play the role you are claiming (correlation is not causation). Throughout my thesis, I have used genome-wide association, cline analyses, pool sequencing, chromatography, histology, and transcriptomic analyses to try to identify candidate genes for color and pattern in Favs. In this post, we are talking about one of these analyses, in which I used transcriptomic data to identify genes that are significantly more expressed in either orange, yellow or white (belly) skin. This work transcriptomic was inspired by Devi Stuart-Fox’s lab research in Australian lizards and a conversation I had a few years ago with Julienne Ng; they used comparative transcriptomics to try to identify candidate genes for color and color pattern in both tawny dragons and frill-neck lizards. You should check their manuscripts out too!
Bulk transcriptomics comparisons, like the one I’ve done (as opposed to single cell transcriptomic comparisons), typically involve many steps: extracting RNA from samples, obtaining cDNA from your RNA and sequencing it, either assembling a transcriptome from the sequenced reads or using a reference transcriptome to obtain read counts, and using very clever mathematical approaches to compare read counts between the tissues you are interested in. Check out some of the explanations on how RNAseq takes place and the methods used to analyze this data in the StatQuest website.
In this publication, we used two approaches to compare the transcriptomic profiles of orange, white and yellow skin: differential expression analyses and gene set enrichment analyses. The former does not assume prior knowledge about the underlying genetic architecture of the trait you are interested in; it tries to figure out if there’s a higher expression of gene ‘A’ in, say, orange tissue than in yellow tissue. Think of it as being similar to running t-tests across thousands of morphometric characters to try to figure out if population ‘A’ is different from ‘B.’ The data is just ‘harder’ to deal with, but a lot of the principles are the same. Gene set enrichment analyses, however, assume that you have some previous knowledge about the genes behind the trait you are interested in; it tests whether either parts or the entirety of the set of genes you are interested in are up- or down-regulated in, say, orange skin relative to yellow skin. In my case, I used the knowledge we (as a field) have gathered on the genetic pathways for carotenoids, pteridines (which non-mammalian vertebrates also use as pigments), and guanines (which squamates use to produce color-reflecting platelets) to come up with the gene sets that I used in the gene set enrichment analyses.
What did we Expect?
Given the amazing work done by earlier anole researchers in chromatography, histology and vision (shout outs to Joe Macedonia, Manuel Leal, Leo Fleishman, John Steffen, Evelina Ortiz, Nancy Alexander, among others), as well as some chromatographic and histological data I’ve gathered, we had some idea of what to expect when we compared expression profiles between the orange, yellow and white tissues in Favs. Anoles have their chromatophores organized into these things called chromatophore units (FYI: this is not true for all squamates, but is true for some amphibians). Anoles typically do not have epidermal melanophores, with most chromatophores being in the dermis. In the dermis, xanthophores (if yellow) or erythrophores (if orange/red) are on top of iridophores (which hold the light-scattering guanine platelets), which are themselves on top of melanophores (I try to depict this in the illustration above). From histology, we know that orange and yellow skin have a larger amount of xanthophores and erythrophores than white skin, which itself has a larger amount of iridophores, and potentially less melanophores, than either orange or yellow skin. Furthermore, chromatographic studies in anoles suggested that orange and red colors in are determined by pteridines (more specifically drosopteridines, the same that makes the eyes of Drosophila red), while yellow colors could be produced by both yellow carotenoids (xanthophylls) and yellow pteridines. Therefore, we predicted that: 1) Orange and yellow skin would up-regulate genes and gene sets associated with the production of carotenoids and pteridines, as well as genes responsible for the maintenance of xanthophores and erythrophores relative to white skin; while 2) White skin would up-regulate gene sets associated with the production of guanine platelets, as well as genes responsible for the maintenance of iridophores. In addition, we predicted that 3) Orange skin would up-regulate the pteridine pathway relative to yellow skin, while yellow skin would up-regulate the carotenoid pathway.
What did we Find?
If we go back to our original questions, we found that differences in phenotype between patches of skin with distinct colors do correlate with differences in gene expression, and that the genetic basis of color and color pattern in squamates is similar to what has been described in other vertebrates. Among a set of approximately 600 differentially expressed genes across all pairwise comparisons between orange, yellow and white skin (out of > 18 k genes in the skin transcriptome we assembled for this study), we identified 13 genes previously linked to color and color pattern across vertebrates (check out the figure below if you like colorful volcano plots). This is a substantial amount given that only around 30 genes have been linked to color pattern in zebrafish, the vintage model-system for color pattern in vertebrates. Furthermore, not only were the color-pattern genes we expected up-regulated in the skin colors we predicted (e.g. CSF1R in orange skin), but these genes were up-regulated in the right direction. Genes associated with the maintenance of xanthophores and the synthesis of pteridines were up-regulated in both orange and yellow skin relative to white skin, while genes associated with the production of guanine platelets and the maintenance of iridophores were up-regulated in white skin.

Fig. 2. Subset of volcano-plots between log2-fold change and -log10 corrected p-values for three comparisons: A. paired orange vs. white, unpaired orange vs. white, and paired orange vs. yellow. The -log10 corrected p-values depicted here were obtained with DESeq2. Results from edgeR and salmon were consistent with those from DESeq2. Each dot represents a gene annotated to the Glowing Ember Bark Anole transcriptome. The vertical dotted light grey lines mar the boundaries of -1 and 1 log2-fold change. Dark grey points represent genes that were not differentially expressed for that skin comparison. Orange, yellow and light gray points represent differentially expressed genes for that skin comparison. Named genes belong to our set of best candidates for color and color pattern. Notice how genes that were not differentially expressed in A. (paired design) but that were in B. (unpaired designs) (i.e. KITLG, CSF1R, PTS) show a consistent pattern of up-regulation across designs. Notice also that albeit non-significant, BCO1 shows an approximate 2-fold up-regulation (i.e. log2-fold change ~ 1) in orange relative to yellow skin.
There were, however, a few predictions that were not corroborated by our results. Among these exceptions were the fact that white skin up-regulated parts of the carotenoid pathway relative to orange and yellow skin, and the fact that orange skin up-regulated both the carotenoid and the pteridine pathways relative to yellow skin.
The first prediction not supported by our data was that white skin up-regulated parts of the carotenoid pathway. This isn’t really unexpected. The carotenoid pathway is very large (here I’m calling the carotenoid pathway the Provitamin A synthesis pathway), with carotenoids playing many other roles in addition to being color reflecting molecules. Importantly, evidence is growing that the deposition of carotenoids as pigments is determined early in the carotenoid pathway, and the part of the pathway that is up-regulated in orange and yellow tissues relative to white tissues is the one that has been linked to pigment deposition in vertebrates.
The second exception implies that Favs might be using not only pteridines, but also carotenoids to produce their deep orange and red colors. Not only that, but we found two genes from the Cytochrome P450 family to be up-regulated in orange tissue. These genes are from the same Cytochrome family that ketolates xanthophylls (typically yellow carotenoids) into ketocarotenoids (typically red carotenoids) in another reptilian group: birds. This implies that Favs are producing orange and red hues by using either drosopterins + ketocarotenoids, or drosopterins + a higher concentration of yellow carotenoids (more on this when I publish my chromatographic results!). Along these lines, our transcriptomic data support the hypothesis that a negative feedback loop described in mice for the intake of carotenoids might be responsible for the higher concentration of carotenoids in orange skin relative to yellow skin.
And What does this Mean? (a.k.a. Why should I care?)
The fact that genes previously linked to color and color pattern across vertebrates were among our set of differentially expressed genes supports the prediction that the mechanisms behind color and color pattern are deeply conserved across vertebrates. Evidence for this conservation also shows up on the genetic basis on the development and maintenance of chromatophores in mice and zebrafish. There, mutations in the same genes led to similar consequences in melanin-based color patterning. There is, however, a twist. Even though squamate species that studied this far use either pteridines or carotenoids as orange and yellow pigments, different species appear to be using different genes in these pathways to produce similar colors. Devi Stuart-Fox’s lab has found amazing evidence that at times animals from different populations could produce similar hues using different pigments according to the availability of pigment or pigment precursors in their diet. If this is true across squamates, it has huge implications on the effects of natural and sexual selection of these traits.
Wrapping up.
After a few years of hard work we identified a clear list of candidate genes for color and color pattern in anoles. Also, our data supported the prediction that the genes responsible for color and color pattern are conserved across vertebrates. Anoles appear to be producing different colors and color patterns by differentially expressing genes from the carotenoid, pteridine and melanin pathways, as well as genes associated with development, maintenance and differentiation of chromatophores. It is, therefore, likely that differences in color across anoles are due to the interaction of many factors, including differences in the activity of transcription factors across populations. Furthermore, from the growing literature in the field, it is likely that animals that appear to have the same colors, and produce similar reflection spectra, use different pigments to do so. This all means that color and color pattern in colorful animals, like anoles, is proving to be a complex, exciting, and burgeoning field to work in.
Next Steps
I’m truly excited about this work, and I’m looking forward to wrap up my PhD in this upcoming year and getting the other pubs from my PhD out. I’m hoping to share with you the results from my genomic, chromatographic, and histological analyses in the near future, which will hopefully give us a better idea on what could be making these anoles colorful. I will, by the way, talk about my GWAS results at the Evolution meetings, and about different introgression of sex-linked markers at JMIH this summer. If you want to reach out to me, I do have a twitter (@ squamatebr), but you’re more likely to get a response from me if you e-mail me (hollandademello at gmail dot com).
Thanks for spending a bit of your time reading this posts. I appreciate it.
Stay safe out there, help each other, and be good.
Pietro
Bonus Question:
What position was the animal that I based my drawing in? Let me know in the comments:
A. Vertical, facing up.
B. Vertical, facing down.
C. Horizontal.
D. Break dancing (Yes, break dancing is a position).
- How Do Anoles Get Their Colors? - May 26, 2021
Leave a Reply