Greetings, Anole Annals readers, from lovely Charleston. It may not be balmy here, but it’s warmer than my usual habitat of Cambridge, Massachusetts, which is currently experiencing an “Arctic front,” which is fancy speak for blistering cold wind. For those of you who couldn’t be here, this morning held some great Anolis talks at SICB, and I was able to attend three. The first was by Maureen Stimola, a senior undergraduate student at Columbia University who did her senior thesis with me in the Dominican Republic this past summer. Maureen’s research project addressed how thermal tolerance (CTmin and CTmax) changes with elevation in the cybotoids (A. cybotes and related trunk-grounds) from the Dominican Republic.
Year: 2012
In September, 2011, Alex Dornburg (Yale), Andy Jones (Yale), Teresa Iglesias (UC Davis), Dan Warren (UT Austin) and I made our yearly pilgrimage to study the marine and herpetological fauna of Curaçao. On the advice of J. Losos, one of our missions this year was to document the dewlap color asymmetry in Anolis lineatus.
In 1967, Stan and Patricia Rand published a paper on the natural history of A. lineatus and noted that:
“The dewlap is large in the male; extended it has a wide border with bright orange skin around a block central spot. The spot is crossed by several widely separated rows of white scales. The border on one side is closely set with yellow or whitish scales, on the other side, the scales are rudimentary and colored like the skin. About half the males have the scales well developed on the right side of the dewlap, about half on the left… one side of the dewlap appears to have a bright orange border, the other side a yellow orange border. The females have a much smaller dewlap, but colored like the males’ and also asymmetrical, though less conspicuously so.”
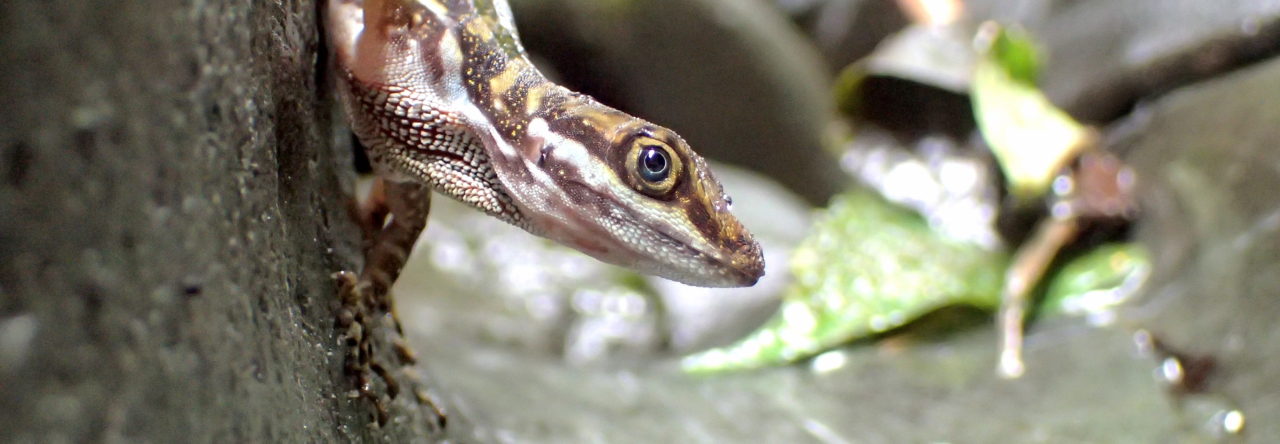
We braved multiple attacks of push-ups and head bobs and managed to collect and photograph multiple individuals.
Note the large, white scales in the orange field of the dewlaps:


versus the other side of the dewlap which lacks the large, white scales:

The orange vs. yellow-orange difference is a bit subtle and not easily visible in these photos, but it’s there. Like Rand and Rand, we found a roughly equal distribution of individuals with the white scales on the left, and those on the right.
What explains this asymmetry? Are they using the different colors to warn males and attract females?


We are thinking of hypotheses to test during our 2012 trip to the island and we’d appreciate hearing other ideas from other researchers.
Illustrations by A. Seago
In a recent AA exchange, it was noted that Ernest Williams’ last publication appeared 11 years after his death. Anthony Geneva wondered “how far one could take posthumous co-authorship. What’s stopping me from including Darwin as a co-author on my next manuscript?”
Indeed, just what are the rules? Are you comfortable with the idea that a paper may be published in the future and the deceased you listed as a co-author, without the opportunity to agree to be a coauthor, much less comment on or contribute to its content? What’s to keep someone just from tacking on the names of prominent figures in a bid to make a paper more publishable or to gain more attention?
In this case, the paper, Poe et al. (2009), made clear their rationale:
This is the first of a series of posts that will review a number of papers that examined species richness patterns in anoles, starting with Rand’s 1969 paper described below and moving towards the present day understanding. Read on!

Species richness predictions from the Theory of Island Biogeography
The empirically observed species-area relationship (SAR) is one of the closest things to a law that we have in evolutionary ecology. All else equal, the larger the area, the more species will be in it. In a paper in 1963, and a book in 1967, MacArthur and Wilson (M&W) put forward the Theory of Island Biogeography (TIB) to explain the species-area relationship on islands. They observed that the number of species that inhabit an island scales positively with island area and negatively with distance of an island from the mainland species source. M&W argued that the SAR is governed by two ecological processes: colonization and extinction. Colonization probability increases with the size of an island and decreases with island distance from the mainland. Extinction probability increases as island size decreases because small islands support smaller population sizes and leave species are more vulnerable to fluctuations in abiotic and biotic environmental factors. Thus, the TIB predicts that large islands close to the mainland will be species rich, while small islands far from the mainland will be species poor. The TIB inspired thousands of papers: according to Google Scholar, the 1967 book has been cited 11,148 times and the 1963 paper has been cited 1,416 times.

Top row, left: A. magnaphallus; Top row, right: A. tropidolepis; 2nd row and 3rd row, left: A. pachypus; 3rd row, right and 4th row: new species, A. benedikti; bottom row: A. pseudopachypus.
Peter Uetz recently pointed us to the Reptile Data Base with a list of all anole species, which appears to be at 378, not including the recently described A. tenorioensis. Make that 380.
The Anolis pachypus complex, a group of high elevation, mid-Central American anoles, has been growing in recent years, with the separate descriptions of A. magnaphallus and A. pseudopachypus both in 2007. Now another species has been recognized, named A. benedikti. Unlike other recent cases in which widespread Central American anoles have been broken into multiple species (e.g., A. tenorioensis), the A. pachypus group is not distinguished by differences in hemipenial shape. By contrast, these species are told apart the good ol’-fashioned way, by differences in dewlap color, as illustrated above.
Anolis benedikti is a cloud fores species found in the Talamancan highlands of eastern Costa Rica and extreme western Panama, predominatly on the Caribbean versant.