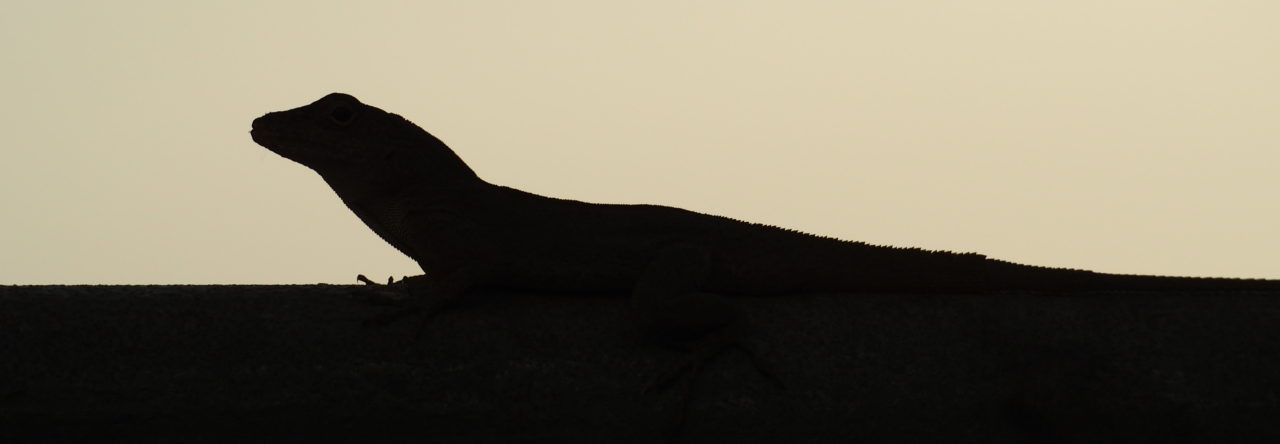

Range map for Anolis aliniger (triangles) and Anolis bahorucoensis (cirlces).
Do you ever stop and think about how long it must have taken Schwartz and Henderson to make all those amazing dot maps in their 1991 opus on West Indian amphibians and reptiles? They plotted known localities for every species of West Indian amphibian and reptile in the days before GPS and GIS! These days, making dot maps of species distributions is considerably less onerous, but often requires the use of cumbersome, expensive, and PC-only programs like ArcGIS. For the past couple of weeks, some folks in my lab – Daniel Scantlebury, Anthony Geneva, and Shea Lambert – have been attempting to make nice distribution maps for Caribbean anoles and other reptiles using the R statistical computing framework (R has a pretty steep learning curve for beginners, but it’s flexible, scriptable, free, and cross-platform). The results so far are pretty exciting. If you have a list of georeferenced localities, you can overlay these points on a very detailed political map in a matter of seconds. We’re just beginning to learn how to tap R’s map making potential and would love to hear from others doing the same! Technical details after the jump…
# R plotting of maps
library(sp)
# Load DR maps
dr <- url(“http://gadm.org/data/rda/DOM_adm1.RData”)
print(load(dr))
close(dr)
dr <- gadm
# Load Haiti map
haiti <- url(“http://gadm.org/data/rda/HTI_adm1.RData”)
print(load(haiti))
close(haiti)
haiti <- gadm
#plot both maps on grid
plot(dr, axes=TRUE, lwd=0.25, xlim=c(-75,-68), ylim=c(17,20.5), tck=0.03, cex.axis=0.65)
par(new=TRUE)
plot(haiti, axes=FALSE, lwd=0.25, xlim=c(-75,-68), ylim=c(17,20.5))
#plot georeferenced localities from comma-delimited text files
#plot bahorucoensis localities as circles
read.csv(“bahorucoensis.csv”) -> bahorucoensis
points(bahorucoensis[,2], bahorucoensis[,1], pch=19, cex=0.75)
#plot aliniger localities as triangles
read.csv(“aliniger.csv”) -> aliniger
points(aliniger[,2], aliniger[,1], pch=17, cex=0.75)
#content of .csv files for each species
#aliniger
“DecimalLatitude”,”DecimalLongitude”
18.4111,-72.2878
18.6047,-71.7747
18.727,-71.617
19.2902,-71.6167
19.3083,-71.6167
19.274,-71.561
18.7864,-71.5214
18.8237,-71.5167
18.6833,-71.4667
18.7004,-71.3862
19.2681,-70.8997
19.2651,-70.8965
18.959,-70.773
18.9111,-70.7641
18.9021,-70.75
18.9167,-70.75
18.9064,-70.7392
18.9333,-70.7333
19.1331,-70.7314
18.8847,-70.7306
18.8811,-70.7283
19.1317,-70.7264
18.9789,-70.6275
18.9167,-70.5896
19.0167,-70.5667
19.4933,-70.5639
19.0155,-70.5405
18.9594,-70.5139
19.4958,-70.5131
18.5333,-70.5036
18.9167,-70.4833
18.6125,-70.4492
#bahorucoensis
“DecimalLatitude”,”DecimalLongitude”
17.963,-71.268
17.9631,-71.2575
18,-71.2422
18,-71.1667
18.025,-71.141
18.0667,-71.1667
18.0833,-71.3
18.0972,-71.2197
18.0978,-71.6428
18.102,-71.075
18.1085,-71.2603
18.1094,-71.2292
18.111,-71.28
18.1119,-71.2372
18.1128,-71.2492
18.1128,-71.2408
18.1131,-71.2503
18.1163,-71.0768
18.1167,-71.2639
18.1178,-71.2564
18.124,-71.269
18.1241,-71.2619
18.1262,-71.2833
18.131,-71.264
18.1319,-71.2499
18.133,-71.255
18.1331,-71.2714
18.1333,-71.1667
18.135,-71.1683
18.136,-71.259
18.139,-71.261
18.145,-71.259
18.155,-71.1486
18.1611,-71.1656
18.169,-71.753
18.172,-71.766
18.177,-71.772
18.1803,-71.78
18.205,-71.757
18.2061,-71.0994
18.2111,-71.2456
18.2132,-71.75
18.224,-71.756
18.235,-72.0581
18.2564,-71.7266
18.2654,-71.7172
18.2692,-71.7133
- JMIH 2014: Early Records of Fossil Anolis from the Oligocene and Miocene of Florida, USA - August 13, 2014
- JMIH 2014: Relative Contribution of Genetic and Ecological Factors to Morphological Differentiation in Island Populations of Anolis sagrei - August 7, 2014
- JMIH 2014: The Ultrastructure of Spermatid Development within the Anole, Anolis sagrei - August 5, 2014
cybokat
Nice work! will try!
220mya
My apologies if I missed it in the script, but what datum does R use for plotting on maps, or does say?
Rich Glor
WGS84. More information can be found at the global administrative areas web page. Check the download section for details on the datum and formats available. For those interested, folks in my lab also just figured out how to plot GIS maps with ecological and elevational data for the Caribbean in R. Just this morning, Shea showed me a 3D version of the digital elevation map for Hispaniola that you can rotate and animate in R. Pretty cool.
Andrea Baquero
I’m interested in plotting the GIS maps in R with ecological and elevational data for the Caribbean. How did they do this?