Winter in Wisconsin is about the worst place you can imagine for a tropical lizard, but that didn’t stop this little one! This brown anole (A. sagrei) was spotted last week (April 2021) in a plant nursery in Madison, WI (ok, not exactly Green Bay…) by a friend of mine, Emily Mitchell. Thanks to her for sending the pic! This individual likely got to Wisconsin as an egg in the soil of a potted plant, and hatched in the nursery. It will have a lonely existence in its midwest nursery home, but at least we can appreciate it!
Anole biologist Chelsea Connor (Photo courtesy of Chelsea Connor)
Lizard biologist Earyn McGee (Photo courtesy of Earyn McGee)
Right now, the United States is wrestling with systemic racism at many levels in our society. And while one may wish to think nature and science stand outside of this issue, this is not the case. Nature-related jobs and hobbies, which many of us AA readers enjoy, are often not safe spaces for Black peoplefor many reasons—we saw a very striking example of this a few weeks ago inCentral Park in New York City. So last week, largely in response to that event, a team of Black scientists presented the world withBlack Birders Week, a week of social media and online events to showcase the Black naturalist community and share their experiences with Black and non-Black nature lovers alike. And while the event was focused on birding, two of the organizers behind this event are lizard biologists: Chelsea Connor and Earyn McGee! I’d like to highlight these two awesome herpetologists and their efforts in such a great week of outreach and community-building.
Anole biologist Chelsea Connor (Photo courtesy of Chelsea Connor)
Chelsea Connor, one of the co-founders of Black Birders Week, is currently a student at Midwestern State University. She studies the interactions between two anoles in her home country of Dominica, the endemic A. oculatus and the invasive A. cristatellus (some of her research was recently covered on AA). She’s active on Twitter, where she posts fun facts about her study animals and shares her experience as a Black woman in herpetology – follow her at @chelseaherps. She also makes wonderful anole-themed art–check it out and buy stickershere!
Earyn McGee is a PhD candidate at the University of Arizona, where she studies the effects of stream drying on lizard communities. She is also a science communicator, educating the public about lizards and showing that Black women belong in wildlife science. She has run a weekly social media #FindThatLizard challenge for several years, introducing the fun of herpetology to many new fans (you can follow her on Twitter @Afro_Herper to play, and support this effort on herPatreon). She also has a newYouTube channel!
Lizard biologist Earyn McGee (Photo courtesy of Earyn McGee)
If you missed the #BlackBirdersWeek event, I encourage you to look it up on social media and online – it’s received lots of press coverage! To get you started, I’m pasting a few articles highlighting Earyn’s and Chelsea’s involvement in Black Birders Week below. And I encourage us all to use this moment to reflect on how we can make our nature-loving communities more welcoming and safe for our fellow naturalists.
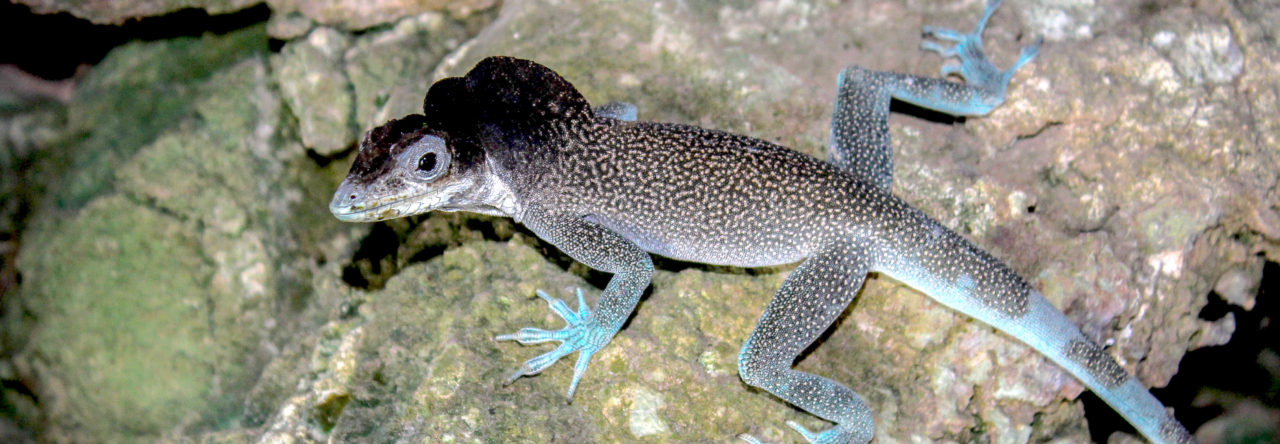
Anolis cristatellus is a great study species for investigating the effects of urbanization. They are widely distributed across the island of Puerto Rico, and occur at high densities in both forests and urban areas. By comparing the morphology, behavior, and physiology of lizards in these two habitat types, a number of anole researchers are currently learning about the effects of urbanization on this species and how the species is responding to these novel environments.
Anolis cristatellus is also named for the huge, beautiful tail crests that males often possess. They are one of a number of anole species to possess a tail crest (25 of ~425 described species have crests), but the function of the crest is still unknown. One of the only studies addressing anole tail crest function suggests that they might be used for signaling across large distances (Charles & Ord 2012), but other possibilities have not been tested. We thought that temperature may play a role as well, with the tail crest allowing increased heat transfer between the anole and its environment (similar to mechanisms that have been proposed for the dorsal fans on Permian synapsids).
My first Anolis, captured in 2012!
In our recent paper, we ( Kristin Winchell, Liam Revell and I) decided to study how these tail crests vary across Puerto Rico in urban and forested areas and test whether any variation we observe in crest morphology is associated with environmental variables that differ across these urban and forested habitats. To do this, we measured tail crest size across three populations using scans of lizard tails that I collected during my summer undergrad REU at UMass Boston many years ago. ‘Twas the first time I ever caught anoles! Sigh, memories…
We then tested whether tail morphology varied across our three sampled municipalities or across habitats types (urban and forest), and whether any observed variation was associated with temperature, precipitation, or openness (i.e. perch isolation).
A typical image of a scanned crest used in our analyses.
We found that tail crest size does vary across the three populations, but in each locality we sampled, urban lizards had larger crests. Interesting! Why might that be ? Well, it turns out that the environmental factors we measured also differ between urban and forest areas. The urban areas we sampled have higher temperatures than the forest areas. The larger tail crests in urban areas could therefore suggest a potential thermoregulatory role. But that’s not the only possibility presented by our data. Urban habitats tend to be more open, which could allow for longer sight lines between individuals, potentially supporting the hypothesis that larger tail crests are used for communication in open environments. But so far, our conclusions are necessarily limited. Nonetheless, even though we don’t know the function of the crest, the fact that crest size differs between urban and forested areas suggests that it’s under some sort of differential selection in these different habitats, which is quite intriguing.
We hope this paper can be a part of a larger body of research around Anolis (and squamate) tail crest function and evolution. Quite a few species have crests, but very few have been studied. If you have tail crest data/pics lying around, I encourage you to get them out there! In the meantime, feel free to read our full paper here.
Dewlap variation in A. fuscoauratus. Photos by Ivan Prates.
One of the most well-known and “classic” anole traits is the dewlap, the (usually) colorful flap of skin under the chin that anoles use to display to one another. The dewlap plays a role in numerous anole interactions, including male-male and male-female displays of aggression or courtship. Throughout the Anolis genus, dewlap color and pattern are both quite variable. Dewlap color is thought to be a sign of reproductive isolation, and has been used by researchers to define and recognize species boundaries, although lots of variation within-species exists as well.
Ivan Prates, a postdoctoral fellow at the Smithsonian National Museum of Natural History, has been exploring this variation with the curious case of the Amazonian slender anole, A. fuscoauratus. The species is distributed throughout much of the Amazon, and different populations vary in dewlap color – some are white, some are yellow, and some are pink! Within each population, the dewlaps don’t appear to vary, but different populations have different dewlap colors, seemingly unpredictably. For example, two study populations that are separated by just 60km show different dewlap morphs, with one population having all yellow dewlaps, and the other having all pink. (Note: only males have dewlaps in this species).
This observation led Prates to two questions: first, does the phenotypic variation represent distinct evolutionary lineages? That is to say, are populations with the same colored dewlap more closely related to one another than to populations with different colored dewlaps? And second, what is driving the diversity in dewlap color?
To answer the first question, Prates performed RAD sequencing on a large number of populations throughout the range of A. fuscoauratus. Prates found a fair amount of genetics structure within the species, and identified areas that have experienced high levels of admixture as well. For example, the Atlantic Forest population and northern South American were genetically distinct, but populations within central Amazonia tend to be relatively admixed with one another. Interestingly, he found that this genetic structure of populations was not related to dewlap color at all. Populations with different dewlap colors were present within each of the distinct genetic clades. So each of the dewlap colors did not come from a single source population, and have instead diverged from one another seemingly at random.
So if the genetic structure does not predict the dewlap color phenotype, what does? Previous work on Greater Antillean anoles has shown that dewlap color and pattern vary across habitat types due to differences in light environment and visibility. Denser habitats are thought to lead to more reflective colors and patterns, while more open habitats lead to less reflective dewlaps. Prates therefore used climate data to assess whether environmental variables were correlated with dewlap color. Similar to the genetic results, Prates found no association between climate variables and dewlap color.
What about species interactions? Previous work has also shown that dewlaps can function as inter-species recognition signals. It is expected that anole species that overlap with one another should have distinct dewlaps, in order to efficiently recognize conspecifics in multi-species communities. Prates addressed this hypothesis by examining the dewlaps of other species of anoles that are sympatric with A. fuscoauratus, and assessing whether dewlap variation might correlate with Anolis community composition. Prates found limited evidence for this hypothesis – for example, in areas where it co-occurs with A. tandai, a blue-dewlapped anole, A. fuscoauratus has a fewer gray-dewlapped populations, which are more similar to blue than the yellow or pink morphs. However, Prates also found that even in sympatry with other yellow-dewlapped species, A. fuscoauratus does not have a reduction in yellow- or white-dewlapped populations.
So what is driving this dewlap diversity? So far, there’s no smoking gun, but a few suggestions come from the data. Prates plans to continue working on this question by digging deeper on both genetic and environmental scales. Stay tuned!
The field of landscape genetics seeks to understand how patterns of genetic diversity vary across a landscape. But an organism’s traits are not just determined by their genome – they are also impacted by processes that affect the way the genome is expressed. The study of such mechanisms (i.e. heritable non-genetically based gene expression) is known as epigenetics, and has become a topic of great interested to evolutionary biologists who aim to understand the processes by which phenotypes change over time and space. Non-genetically based phenotypes can be the targets of selection, can impact the plasticity of traits in different environments, and more.
Understanding the impact of epigenetics on evolutionary processes is difficult, because it is hard to disentangle the genetic and epigenetic effects on phenotypes. Of course, epigenetics are not independent from the underlying genetic code – the genes that are expressed are a part of the genome after all. Thus because populations differ in genetic structure, it is difficult to determine whether differences in phenotypes across populations are driven by genetic changes, or epigenetic changes. To understand the influence of epigenetic changes on phenotypes, it is necessary to “subtract” the effects of the underlying genetic variation.
Ian Wang decided to tackle this problem using a well-studied Anolis species, A. cristatellus. Wang is interested in understanding what factors drive epigenetic patterns; but before understanding the factors involved, it is first necessary to describe the patterns. Wang chose to focus on A. cristatellus because it is distributed widely and throughout various environments on the island of Puerto Rico, and is therefore a good candidate for understanding how populations diverge across geographic regions (i.e. isolation by distance) and in different habitats (i.e. isolation by environment).
Wang and colleagues collected tissues from 8 localities, some of which were located in the xeric southwest, and some of which were located in the mesic interior. He performed RRBS sequencing, which captures information about methylated regions of DNA, and therefore provides information on variation in gene expression across populations (i.e. epigenetic variation). He also performed ddRAD sequencing, which captures information about genetic differences across populations (i.e. genetic variation).
In analyzing these two complementary datasets, Wang found that epigenetic and genetic distances were correlated between populations – that is to say, populations with high genetic divergence also had high epigenetic divergence. Recall that epigenetics are to not wholly independent from genetics, so this result is expected. However, each of these two types of variation – genetic and epigenetic – were also influenced by other factors.
In terms of genetic divergence, geographic distance was the strongest correlate – populations that were close to one another were more similar than populations that were further away. Interestingly, temperature and vegetation also appeared to play a role as well. In terms of epigenetic divergence, genetic distance (as represented by Fst) was the strongest predictor. Interestingly, however, vegetation was also a strong predictor as well. This suggests that on top of the genetic changes that accumulate when populations diverge, additional epigenetic shifts have also occurred, and are likely impacting the populations’ fitness in their respective environments.
These results highlight the importance of considering both genetic and epigenetic changes in studies of adaptive variation. Genomes alone may not explain the whole story! Wang is continuing this research in multiple avenues, including comparing results across species (e.g. comparing results from A. cristatellus to another trunk ground anole, A. cybotes on Hispaniola), and digging deeper into the functions of individual outlier loci from the RRBS sequencing. Looking forward to hearing more about this emerging perspective on adaptation in anoles!
In the 1990s, volcanic eruptions occurred on the island of Montserrat, which of course led to a reduction in the resident population of the plymouth anole, Anolis lividus, in the area of the island affected by the blast. However, populations appear to have recovered. But how? Were there a limited number of individuals that survived the volcano, and have now succesfully repopulated? Or did individuals from the northern region of the island colonize the southern region after the eruption? In addition, different populations throughout the region exhibit different body coloration, ranging from dark green to light brown. Does this morphological diversity represent underlying genetic divergence?
Catherine Jung is addressing these questions using genetic data from historical (1991-1992) and current (2018) samples. She has sequenced one nuclear and two mitochondrial genes to determine the relatedness among current populations across the island. Interestingly, she’s found no signatures of genetic structure across the island so far. She plans to continue this work by incorporating the genetic data from the historical specimens and performing more formalized demographic models to determine whether current southern populations (which were re-populated after the volcano) are more related to current northern populations (unaffected by the volcano), or historic southern populations (pre-volcano). As of right now, the question remains open, but stay tuned for more data! Answering these types of questions about the dynamics of population recovery is an important part of conservation research and application, and Jung’s work will contribute to our understanding of these processes in anoles.
I recently wrote a post on the history of Anolis species descriptions using the Reptile Database (Uetz & Stylianou 2018). This got me thinking, how does my current institution fit into this? I’m currently a grad student in the herp department at the Museum of Comparative Zoology, former home of many anole greats, including Albert Schwartz, Ernest Williams, Skip Lazell, Jonathan Losos (still affiliated but now based at WashU), and many more. And as Jonathan has pointed out previously, it’s home to the greatest number of Anolis specimens of any museum. So I wondered, with such a rich history of anole research, what do our collections look like? How many specimens do we have now? How many species? How has the collection grown over time? So get ready for Anoles by the Numbers Part II: MCZ.
A brief note on methods – all data comes from a spreadsheet I downloaded of all current Anolis specimens in the MCZ from MCZBase (downloaded 2/8/19). For total numbers of specimens per species/subspecies/locality, I simply count records (each record corresponds to a single specimen). For the main summaries of collectors, I treat every collector listed with a specimen as independent, so if someone is listed as the main collector for one specimen but as a “co-collector” for 9 others, they will be summarized as collecting 10 specimens. Due to some formatting issues, a small number of specimens got filtered out (early ones in particular), but I think it’s a pretty good start. I also did a subset of visualizations for the “Top 10 Collectors” – these were defined as the 10 researchers who collected the most specimens overall.
The MCZ was founded in 1859 by Louis Agassiz (more on the history here). The first Anolis specimen collected for the MCZ was an A. carolinensis from Milledgeville, GA collected in 1854 (before the MCZ was founded), but the collector is unknown. I can’t track down much info about that specimen. More Anolis specimens were deposited in 1858 and 1859, and since then, the MCZ Anolis collection has grown to include a total of 52,293 specimens. 44,889 of these have specific info on when they were collected.
So, when were the peak periods of growth for the Anolis collection? Looks like the majority happened in the 1960’s and 1970’s.
These specimens were collected by 886 researchers. Most collected <100 specimens each, but a few collected tons! (That doesn’t include the prodigious researcher we know and love, “et al.” I took them out of the analysis.) Some of these collectors spread their work over a number of years, while some had very concentrated efforts. The top 10 collectors together collected a whopping 21,564 specimens.
And how many species do these specimens represent? In total, the MCZ has 378 species (out of 427 described), so 88% of species diversity! Not too shabby. About half of the species are represented by <10 specimens, but a fair number of them have tens to hundreds of specimens. Eleven species even have more than 1000 specimens each! From highest to lowest, these are: distichus, cybotes, sagrei, cristatellus, roquet, grahami, marmoratus, gundlachi, lineatopus, brevirostris, and pulchellus (they’re not on the plot below because they cause so much skew).
What about type specimens? While we don’t have the type for the genus Anolis (that honor belongs to the North Carolina Museum of Natural Sciences), we do have 146 species holotypes! Their collection follows a similar pattern to general Anolis collection, with a peak in the 60s-70s, but is more scattered throughout the 1900s.
How were all of these specimens geographically distributed? Unsurprisingly, considering the history of research on Caribbean diversification and ecomorphology at the MCZ, 72% of the specimens in the collection came from Caribbean Islands, with 39% from just the Greater Antilles. Central and North American species make up an additional 22%, while South American species make up only 6%. A few specimens came from introduced populations in Guam, Japan, and Micronesia. Hopefully the collection will continue to grow and expand as the field of anole research does too!
I hope you’ve enjoyed this journey through MCZ Anolis history. I’m still relatively new to the field of Anolis biology myself, so if you have any insights or perspectives (or suggestions of other things you’re curious to see with this data), please leave them in the comments!
As we all know, anoles are super diverse, but how diverse exactly? I often read that there are ~400 species of anoles, but how many precisely? And what about subspecies? And who described them?
Other AA authors (e.g. Greg Mayer, Rich Glor) have written about these questions in the past, but I’d like to add to this thread of anole history by using a great new resource – Peter Uetz’s reptile database. If you’ve ever googled any reptile species, you’ve probably found yourself on the Reptile Database website at some point, which has great info on species taxonomy, distribution, and often natural history. But recently, the database itself was published in Zootaxa with some interesting stats and plots of reptile species descriptions over time. The database is nuts – it contains information on the taxonomy of literally every reptile species! It’s a really incredible resource. And since it’s got every reptile, it has every anole! So I decided to explore the Anolis section of this database.
First, a couple details – the main data contained in the database is the species taxonomy, species description date, and author(s) of the description. For the main summaries here, I treat every author of a species description as “describer” whether they are the lead author or not, so if someone is a lead author on one description, but a coauthor on nine others, they will be summarized as describing 10 species. However, the info on number of coauthors per description and author order is retained. Also important to note that the database only contains current taxonomy; species or subspecies that have been sunk/synonymized/etc. won’t appear.
So let’s jump in! According to the Reptile Database at the time of publication (Jan 2018), there are 427 species of anoles. The number of new species descriptions peaked in the 1860’s, again in the 1930’s, and again in recent years. A number of you reading this are no doubt represented on this plot!
In total, Anolis species have been described by 171 different researchers. 21% of these species descriptions were done by just three people: E. D. Cope, Ernest Williams, and Gunther Koehler (currently active). Wow! Many of the remaining authors (47%) only described one species. The rest fall somewhere in the middle. After the three mentioned above, the researchers who have described the most species are Garrido (26), Boulenger (22), Barbour (18), Schwartz (18), Dumeril (15), Hedges (15), Poe (15), and Smith (15).
We’ve looked at how species have been described by different researchers, but I was curious to know how collaborative this process has been – how many authors normally contribute to a given species description? Well, 274 species descriptions were written by one author, 92 by two authors, and 61 by three or more authors. So most anole species were described by one or two authors.
As one might expect, as science as a whole has become more collaborative, the number of coauthors for species descriptions has increased over time. Almost all descriptions up to the early 1900’s were done by one author, while in the 2000’s that’s almost never been the case.
Now what about subspecies? According to the Reptile Database, there are currently 144 described subspecies from 36 different species. Most of those species have just a few subspecies, but a few of them have higher numbers, with a maximum of 11 in A. distichus and A. equestris. In the case of subspecies, 52% were described by just three people! Albert Schwartz, Orlando Garrido, and Skip Lazell (hi Skip!). Subspecies descriptions really hit a peak in the 1970s.
Most of the species that are split into subspecies are distributed in the Caribbean islands (33 of the total 36). Is this just because more phylogeography and taxonomy work has been done on the islands? Or is this another example of how patterns of diversification are different between mainland and island environments? I think probably the first.
Lastly, what was the first anole described? I thought it was A. carolinensis, but was surprised to learn that it was actually A. bimaculatus! Although that species was originally described as Lacerta bimaculata, later reassigned to Anolis. The first species actually described as Anolis was still not A. carolinensis though – it was A. auratus! Described by F. M. Daudin in 1802. So why is A. carolinensis the type specimen for the genus? Well, in 1963, Hobart Smith, Ernst Williams, and Skip Lazell petitioned* to change the type species to A. carolinensis due to a dubious prior designation of the genus type. The ICZN voted to approve their proposal, and granted the change in 1986**. For those interested in a deep dive, take a look at the 1986 decision**, which describes the back-and-forth between the the original proposers, the nay voters (Dupuis and Holthuis), a yay voter (Thompson), Jay Savage, and A. F. Stimson in the Bulletin of Zoological Nomenclature.
I hope you’ve enjoyed this brief history of Anolis by the numbers. Stay tuned for Part II: a look at the history of the Anolis collection at the Museum of Comparative Zoology!
Thank you once again to everyone who participated in this year’s Anole Annals photo contest! As usual, we received tons of great photos, and we’re ready to announce the results. First up, the grand prize winner, is the above photo of Anolis conspersus, taken by Thijs van den Burg. The second place winner is below, Anolis oculatus montanus, by Gregor Weidlich. Congratulations!
The rest of the winners are listed below, and their photos can be seen in the 2018 calendar here! Click the link to order your calendar.
Congrats again to all the winners, and happy holidays!
Winning photos: Anolis conspersus, Thijs van den Burg Anolis oculatus montanus, Gregor Weidlich Anolis luteogularis, Thijs van den Burg Anolis carolinensis, Nick Herrmann Anolis huilae, Cristian Castro Morales Anolis allisoni, Arnaud Badiane Anolis wattsi. Geoffrey Giller Anolis allogus, Thijs van den Burg Anolis porcatus, Jesús Reina Carvajal Anolis nubilus, Colin Donihue Anolis grahami, Nathan Wright Anolis porcatus, Arnaud Badiane
Thanks to all who submitted photos for the Anole Annals 2017 calendar contest–we received lots of great submissions! We’ve narrowed it down to the top 24, and now it’s time for you to vote! Choose your 5 favorites in the poll below. You can click on the thumbnail to view full-size images. You have 10 days to vote – poll closes next Friday at midnight (11/17). Spread the word!