Tag: evolution 2016

Evolution 2016: Polar Vortex Revisited

Shane Campbell-Staton giving his talk at Evolution 2016

Shane Campbell-Staton giving his talk at Evolution 2016

We’ve heard about the effects of polar vortexes here on Anole Annals before. The infamous 2013/2014 event brought record-breaking snow and low temperatures to the Southern U.S., leaving people and animals both a little chilled. This created the perfect opportunity for Shane Campbell-Staton to investigate the effects of such extreme events on thermal tolerance of the native Carolina Anole, Anolis carolinensis. Shane also spoke about this at SICB earlier this year, and AA contributor Martha Muñoz covered the talk pretty thoroughly here on Anole Annals. Nevertheless, I’ll summarize some key points here in case you missed it.

carolinensis frozen

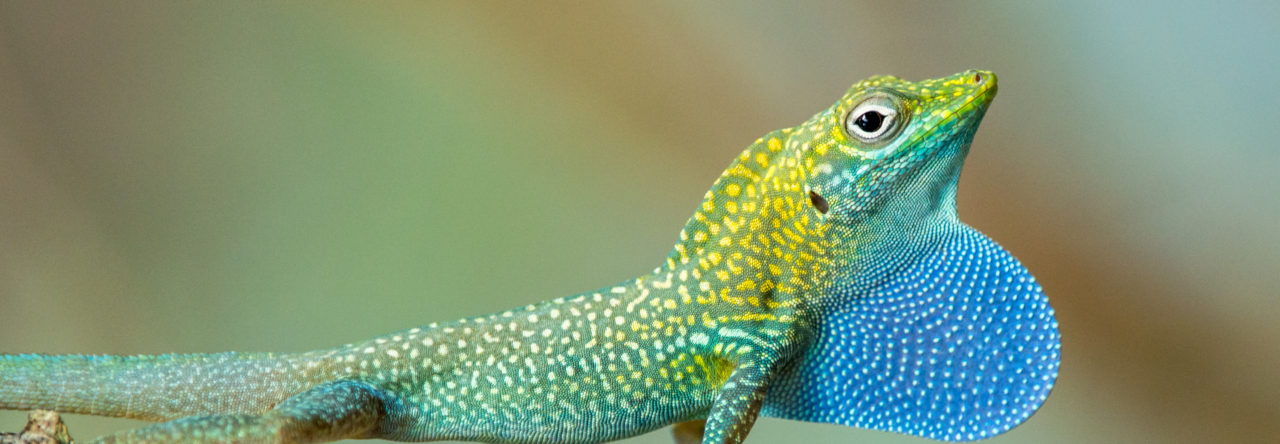
An unlucky lizard during the polar vortex snow storms in the South.

Shane got lucky in the sense that he had measured thermal tolerance in August 2013 for populations affected by the polar vortex, 5 months before the event. Typically, the cold arctic air is tightly constrained around the North pole, but periodically the boundaries weaken and the cool air expands southward. These events are not regular, so Shane had no idea one was coming that winter or that it would extend so far south. It was serendipitous that his study populations, 3 in Texas and 1 in Oklahoma, were impacted by the extreme weather event. This species, particularly in the Southern portion of its range, is not used to low temperatures and reports came in of anoles dying off during the storm.

Air temperatures for January 5-7, 2014, compared to the 1981-2010 average. Map by NOAA Climate.gov

So Shane returned in August of 2014 and sampled again, curious as to how this cold impacted thermal tolerance. He found that tolerance to low temperatures, measured as critical thermal minimum (CTmin), was lower in some populations after the event! Even more, the difference was greatest in the Southernmost population (Brownsville, Texas). Shane returned again in the fall of 2014 to see if this effect persisted or if it was simply a plastic response to the event. He found that the populations sampled in 2014, and presumably their offspring, still had lower critical thermal minimums. This result suggests that the extreme cold weather had caused an evolutionary shift in cold tolerance via natural selection: only the animals that could tolerate the cold temperatures survived and passed on their cold-tolerance genes. Shane went on to conduct a common garden study to verify that the trait was not simply a plastic response. He found that the lower CTmin persisted in lab-reared animals: strong evidence that these shifts had a genetic basis.

Lastly, Shane looked at the functional genomics of cold tolerance. Using liver tissues to obtain transcriptomes (representing expressed genes), he found several gene modules associated with thermal tolerance including some associated with respiratory electron transport chain, lipid metabolism, carbohydrate metabolism, and angiogenesis/blood coagulation. He also found that the gene expression patterns in the Southern populations affected by the storm resembled the Northern populations that more regularly experience cool temperatures, indicating a common genetically based adaptive response across populations.

Evolution 2016: Using Anoles to Understand Shifts in Forests

2016-06-18 19.20.32

Ivan Prates presents his poster at Evolution 2016.

Here at Evolution 2016 there have been a lot of anole talks and posters. In fact, there have even been several that pretend to not actually be about anoles. Ivan Prates presented a poster which he insisted, despite multiple pictures of anoles and the use of anole DNA, was not actually about anoles… Instead, this poster was actually about the historical extent of Brazilian forest cover (or so he says).

In short, Ivan used genomic data to understand historical patterns of dispersion and distribution of South American anoles in order to infer patterns of rainforest expansion and contraction. He suspected that the geological data gave a false interpretation of rainforest patterns in Amazonia and the Atlantic Forest in Brazil, and that anoles could help tell the true story of how the forests have changed over time. By looking at species with strong genetic signals associated with forest shifts he hypothesized that true forest patterns could be elucidated based on the historical demography of these species.

Ivan and coauthors looked at three species of lizards: Anolis punctatusAnolis ortonii, and Polychrus marmoratus. They used the next-generation sequencing technique Genome by Sequencing (GBS) to answer three main questions: (1) Did all 3 species experience range expansions simultaneously? (2) Did populations expand and contract at similar points in time? (3) How did population sizes vary over time? While all three of these questions are about anoles, don’t forget that this poster was actually about the forest.

Ivan found that the Atlantic Forest individuals composed a monophyletic group nested within the Amazonian lineage. This suggests that the anoles of the Atlantic Forest on the coast actually arose from a single colonization event from Amazonia. The land between Amazonia and the Atlantic forest is presently quite arid compared to the rainforest – more like grassland. This presumably forms a barrier to contemporary dispersal, which implies that historical dispersal must have involved greater habitat connectivity. So Ivan’s results support the hypothesis that the forests experienced a drastic historical expansion creating a contiguous habitat that enabled dispersal around 1 million years ago. Interestingly, the timing for the dispersal of all 3 species was approximately the same. A million years ago seems to have been the ideal time to move to the coast for Brazilian anoles.

Ivan and his colleagues also looked at how populations size changed over time. He found that whereas Anolis punctatus experienced a trend of population expansion, Anolis ortonii and Polychrus marmoratus experienced population contractions. It was surprising to the authors that these species did not respond the same – why did only one of the species experience population expansions? They suspected that the expansion of one species might be related to the population contractions of the others, perhaps because of competition. However, their analysis on synchrony of population trends proved otherwise. They found that although trends within species were synchronized across populations, between species the shifts in demography were asynchronous. In other words, when one species expanded or contracted in population size, the others were stable. Ivan concluded that this was support for the idea that these populations were not influencing each other and that instead there was some other factor independently controlling population size fluctuations – perhaps precipitation patterns.

In conclusion, Ivan told me a lot about the demography of anoles during the Quaternary, and a little about the forest. I look forward to hearing more about his “forest” research on these understudied mainland anoles!

Click for a larger version of Ivan's poster!

Click for a larger version of Ivan’s poster!

Evolution 2016: Genomic Insights into Anolis carolinensis Phylogeography

2016-06-19 15.29.31

Anoles, in particular Anolis carolinensis, have long been considered an ideal group for studies investigating thermal physiology, reproductive endocrinology, and even regeneration. With the recent publication of the A. carolinensis genome  (see AA posts on this here and here), the possibilities for new genomic studies in this new model species have significantly increased.

Joseph Manthey and co-authors used this new resource to clarify the phylogeographic relationships of A. carolinensis. Previous research on the phylogeography of A. carolinensis using both mitochondrial DNA and nuclear DNA showed that there were 5 clades. However, the relationships between these groups differed between the two approaches. Joseph looked at the genomes of 42 individuals from 26 localities across the native range to determine the true evolutionary relationship between regional groups and to shed light on the demographic histories of the groups. Manthey sequenced 500 loci using an anchored hybrid enrichment approach.

2016-06-19 15.36.32

STRUCTURE analysis showed that the clusters had little admixture

Manthey et al. found that the genomic data predicted 5 genetic groups, in agreement with both the nuclear and mitochondrial analyses previously done. Their results also indicated that the 5 genetic clusters were distinct with little admixture. However, the relationships between groups did not agree with either the mitochondrial or nuclear trees, yet all nodes had extremely high support (93-100%)

Finally, Manthey commented on the likely timing of this diversification and associated demographic trends. Their results indicate that the initial split occurred during the late Miocene or early Pliocene and that the remaining diversification occurred during the Pleistocene. They also found that the most Southern population had a significant number of fixed genes while other populations did not. This suggests that this group was likely the oldest and most stable and supports an “out of Florida” hypothesis of diversification.

2016-06-19 15.44.01

Evolution 2016: It’s Getting Cold in Here!

2016-06-18 18.53.31

Tamara Fetters with her poster at Evolution 2016

Tamara Fetters, from the McGlothlin lab at Virginia Tech, reported on her ongoing work on thermal physiology in Anolis sagrei during the first poster session here at Evolution 2016 in Austin, Texas. Tamara looked at thermal tolerance and sprinting abilities at different temperatures and how that related to the latitude of the population. Specifically, she asked if lower temperatures regularly experienced by the Northern populations influence cold tolerance and performance at those temperatures. She expected that Anolis sagrei, native to Cuba and the Bahamas and introduced into the Southern U.S., would show signs of adaptation to its new, colder home in the more Northern mainland populations compared to the native range island populations in the South.

Tamara’s poster focused on two main experiments. In the first she calculated thermal tolerance to cold temperatures using a classic critical thermal minimum (CTmin) setup: with an ice bath she slowly lowered the body temperature of each animal until it was unable to right itself. This method approximates the minimum temperatures that the animals can handle in the wild. She found a clear trend showing a decrease in the minimum temperature tolerated as latitude increased. In short, Northern populations could handle the cold and Southern populations could not.

In the second experiment, Tamara acclimated the lizards to 6 temperatures ranging from 12-41 °C before running them up a track to calculate sprint speed. Tamara used an impressive 25-50 animals from each of 5 populations! She calculated sprint speed from the high-speed video she took using the program Kinovea. Tamara found that across all temperatures the most Southern population ran the slowest while the most Northern population ran the fastest, with the differences remaining fairly constant.

So what’s next for Tamara? She is planning on rearing animals in a common garden setup with some animals in hot temperatures with low variability between day and night (mimicking the native range, Southern habitats) and some animals in cool temperatures with high variability between day and night (as is experienced in the Northern habitats). She hopes that these studies will help her understand the genetic basis of this thermal tolerance and the extent of plasticity in thermal adaptation.

One last note – Tamara wanted to thank Anole Annals for helping her determine her study locations. She was able to determine which areas were likely to have Anolis sagrei and how far North they have spread because of Anole Annals posts (like this one) and comments.

2016-06-18 18.54.43

Click to view a bigger version of Tamara’s poster

Powered by WordPress & Theme by Anders Norén