Category: Lizards in an Evolutionary Tree

Cases of Interspecific Hybridization within Anolis of the bimaculatus Group Produced in a Private Breeding Facility


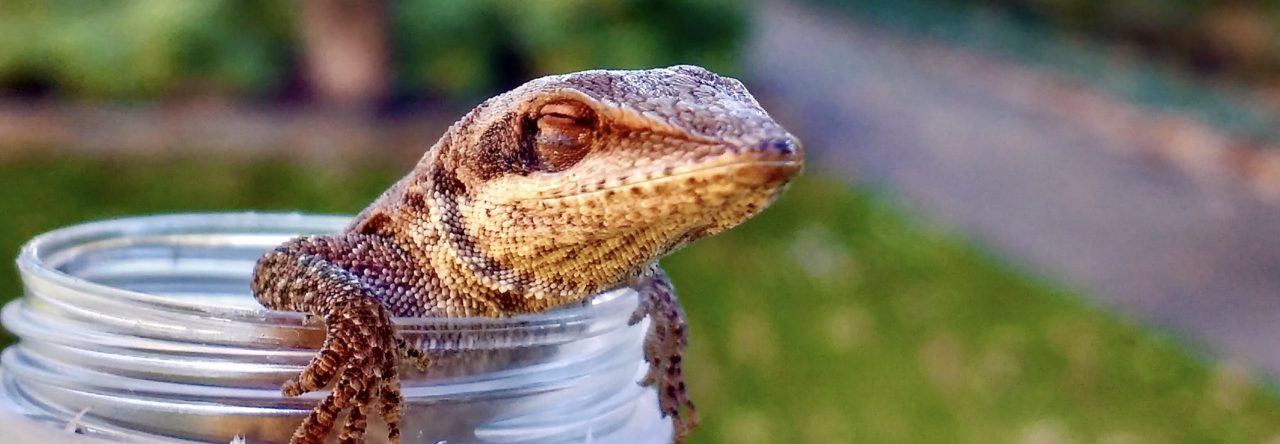
Fig.1) Left: Anolis bimaculatus male (top) and A. leachii male (below) for comparison. Right: adult male A. leachii x A. bimaculatus hybrid.

We all know examples of interspecific hybrids in animals such as the Liger, the Zhorse or the Calico Chuckwalla or even intergeneric hybrids in plants such as orchids. Even within Anolis, there are well known examples of interspecific hybrids such as Anolis aenus x Anolis trinitatis on Trinidad.

I was able to produce fertile hybrids of different members of the bimaculatus group in my breeding facility which I want to show you in this post.

I am a private reptile keeper and breeder and have been working with Lesser Antillean Anolis, mainly  in the sense of keeping and breeding, for 20 years. About three years ago, a good friend of mine told me his A. oculatus and A. terraealtae, which he kept together in a small greenhouse, had interbred and produced offspring. This was amazing to me, as I thought they were genetically too far apart. Shortly after that, out of interest and curiosity, I paired up some different species of my collection with the aim to produce hybrids. I was interested if it is possible to interbreed them in general, and also I wanted to see what the hybrids would look like. So in 2020, I paired up …

1) a male A. marmoratus marmoratus with a female A. ferreus

2) a male A. leachii with a female A. bimaculatus

In both cases, I used a large adult male and a young adult female that was raised single and had never been with any other Anolis before. I introduced the female into the male‘s enclosure and in both cases the male started courting the female immediately and mated with her. After the copulation, I separated the female again and collected the eggs over the course oft he next months. Long story short: I was able to obtain viable hybrids, raise some of them to maturity, paired this F1 generation again and produce viable F2 hybrids.

To describe the hybrids, I would say that they are generally very much intermediate in size and color regarding their parent species, both in males and females. But just look at some of the results (above and below):

Fig.2) Left: Anolis bimaculatus female (top) and A. leachii female (below) for comparison. Right: adult female A. leachii x A. bimaculatus hybrid.

Fig.3) Left: Anolis marmoratus marmoratus male (top) and A. ferreus male (below) for comparison. Right: adult male A. m. marmoratus x A. ferreus hybrid.

Now, I have some thoughts about this. We know that genomes diverge in isolation until the accumulated differences result in “speciation“ and/or reproductive isolation, as it is the case with the Anolis in the Lesser Antilles. With the use of molecular clocks such as the cytochrome b mitochondrial gene and geological dates, we can measure the genetic distance and estimate the timespan of separation of these taxa and project their phylogenetic relationships.

But how genetically distant or how long or over how many generations do two species have to be isolated to be genetically incompatible in the sense of not only being recognized as separate species by us, but also not being able to reproduce? Could Anolis be used as a model group for a question like that in general? Which would be the most distantly related Anolis species that would possibly be able to reproduce? Is there any specific pairing that would be of special interest?

Short disclaimer: None of the hybrids will return into nature. They live a healthy and fulfilled captive life like any other captive Anolis. They are just fine and healthy. Please do not blame me for this project.

Resolving Phylogenetic Uncertainty in Anoles Using Treescape

It’s an all-too-common situation: you would like to infer a phylogeny for a set of organisms, you try a few different methods and you end up with many different trees. Even with the most careful choice of software, settings, tree priors, and the most beautifully converged Bayesian posterior likelihood, you may find that the maximum clade credibility (MCC) tree has low posterior support for certain deep clades.

MCC tree with posterior supports

Anole MCC tree with posterior supports, from Geneva et al. [1]

Tree inference is very complicated, particularly for species trees, and is hampered by factors which include the vast size of tree space, conflicting signals from different genetic loci, confusing signals from convergent evolution, and non-tree-like evolution (recombination, hybridisation, etc.). Geneva et al. experienced just this sort of difficulty when they performed a comprehensive Bayesian phylogenetic analysis of the distichus group of trunk ecomorph anoles [1]. Their MCC tree is reproduced here, and the posterior support values show uncertainty in the branching structure of various deep clades. There are many combinations of ways to resolve these uncertain splits. We wanted to see which alternative trees were supported by the data.

In our recent paper [2] we present a method for handling phylogenetic uncertainty and incongruence. It takes a set of trees and “maps” them into a simple plot where similar trees are grouped together and more different trees are placed further apart. Where many similar trees are clustered together, contour lines indicate the density of points in that region. We began the development of our method theoretically, making sure we had designed a robust mathematical definition for tree distances which would correspond to biological intuition and lend itself to good quality map projections. Then, working closely with biologists, we fine-tuned our method for specific applications with real data and wrote the R package treescape [3] so that anyone can use it – there’s even a handy web app version which requires no knowledge of R.

treescape MDS plot: each point represents a tree, and proximity of points represents similarity of trees. 1000 trees are plotted here, many identical, so contour lines indicate density of points. Colours correspond to clusters of similar trees.

treescape MDS plot: each point represents a tree, and proximity of points represents similarity of trees. 1000 trees are plotted here, many of which are identical, so contour lines indicate the density of points. Colours correspond to clusters of similar trees.

When we applied our method to the trees from the analysis of Geneva et al. [4], we found that there were distinct “clusters” of equally likely tree topologies. It is reassuring that the MCC tree belongs to the largest of these clusters (highlighted on the plot by a yellow triangle), but clearly it cannot represent all of the likely tree shapes on its own. By taking a representative tree from each of the six or so tight clusters, we obtain a more thorough summary of the range of trees supported by the analysis. Such representative trees, taken from the geometric “centre” of each cluster, are credible summary trees with real branch lengths, unlike trees from other summary methods which can suffer from strange behaviour such as negative branch lengths.

We find that there are alternative placements of certain taxa, particularly the ocior, distichus, dominicensis2 clade, and (in our supplement) we explore some of the knock-on effects of using these different tree shapes when analysing the evolution of the anoles, specifically their geographical origins and transitions in their dewlap colour. For instance, we show here a representative tree from each of two different clusters on the map. The trees support ocior, distichus, and dominicensis2 being more closely related to anoles from the East of Hispaniola (the North paleo-island) or the South-West (the South paleo-island) respectively. Both evolutionary histories are supported by the data; in the absence of further research, there is no reason to exclude any of the alternative representative trees identified by our method.

Representative tree from top left cluster

Representative tree from top left cluster

Representative tree from top right cluster

Representative tree from top right cluster


[1] Geneva, A. J., Hilton, J., Noll, S. and Glor, R. E. (2015). Multilocus phylogenetic analyses of Hispaniolan and Bahamian trunk anoles (distichus species group). Molecular Phylogenetics and Evolution, 87:105-117.

[2] Kendall, M. and Colijn, C. (2016) Mapping phylogenetic trees to reveal distinct patterns of evolution. Molecular Biology and Evolution, first published online June 24, 2016. DOI: 10.1093/molbev/msw124

[3] Jombart T., Kendall M., Almagro-Garcia J., Colijn C. (2015). treescape: statistical exploration of landscapes of phylogenetic trees. R package version 1.9.17.

[4] Geneva A. J., Hilton J., Noll, S. and Glor, R. E. (2015). Data from: Multilocus phylogenetic analyses of Hispaniolan and Bahamian trunk anoles (distichus species group). Dryad Digital Repository.

20-Million-Year-Old Fossils Reveal Ecomorph Diversity in Hispaniola


Twenty exquisitely preserved anole fossils in 20 My old Dominican Amber have been reported on in a paper out in Proceedings of the National Academy of Sciences (PNAS) this week.

Previously on AA, I reported that the search was on to find anole fossils in order to piece together the anole family tree. We were extremely fortunate to find in the end 38 amber fossils with anole inclusions, sourced from museums such as the Staatliches Museum für Naturkunde Stuttgart, Germany, American Museum of Natural History, and Naturhistorisches Museum, Basel Switzerland, as well as from generous private collectors.

All of the fossils were exquisite, stunningly-preserved anoles in Dominican Amber. Sometimes just a foot or tail was preserved, sometimes a whole limb or two, or an isolated head, but occasionally a whole lizard was preserved laid out as if it has been pressed into resin just moments before.

Modified from Figure 1 of Sherratt et al. 2015 PNAS.

Modified from Figure 1 of Sherratt et al. 2015 PNAS.

Using micro-CT scanning to peer inside the fossils, we were delighted to find well-preserved skulls and skeletons. We were surprised to find that many of the amber pieces had air-filled pockets representing where the lizard body had once been (but subsequently mostly rotted away), and the scales had left their impression on the amber. This allowed us to view the scales of the limbs and toepads in the greatest of detail.

The forelimb lying atop belly scales of a trunk-ground fossil, specimen M of Sherratt et al. 2015.

The forelimb lying atop belly scales of a trunk-ground fossil, specimen M of Sherratt et al. 2015.

Twenty of these fossils were complete enough, or preserved with the right body parts (limbs with a pelvis, or toepads with countable lamellar scales) to study qualitatively. I micro-CT scanned 100 modern specimens from the Harvard MCZ collection, representing adults and juveniles of all the ecomorphs in Hispaniola. With these data, I build up a dataset of measurements of the limbs, skulls and pelvic girdles that could be used to compare with the fossils. Working fossil by fossil, I used discriminant function analysis to assess the probability that the fossil matched each of the modern ecomorphs.

The fossil twig anole, from Jose Calbeto of Puerto Rico.

The fossil twig anole, from Jose Calbeto of Puerto Rico.

The results were very exciting. We found evidence for four of the six ecomorphs in the amber. Trunk-crown were the most abundant, but there was also one that fell within the twig anoles, two that fell with trunk and two with trunk-ground anoles. Not all the fossils could be assigned to an ecomorph with high probability. Though, my gut feeling is that there is a second twig anole (specimen P) based on the distinct few lamellar scales on its widely-expanded toepads, but sadly it didn’t have enough skeleton and no hind limbs preserved to add to the analysis.

We didn’t find any fossils that resembled crown-giants or grass-bush anoles. Why?

BSA of Norops lineatopus

Geometric Morphometric Analysis of the Shoulder of Jamaican Anoles

garmani mating trivers IIxBirds are lovely animals. Our avian friends swoop through the air, defecate on field equipment, and consume lizards. What’s not to like?! Well, their shoulder region, for example. Lost interclavicle, reverted muscle pathways, and so many other anatomical adaptations that appear crucial for the modern avian life style, but that are hard to explain in a gradual-evolutionary context. Reconstructing the structural evolution of the avian shoulder remains a challenging task to students of biomechanics and kinematics. When I left my European homestead to enter the Canadian realm of biological sciences, I was hoping to solve the evolutionary mystery of the avian shoulder, at least in part. Alas, the discovery of anoles sent me on a much more convoluted journey.

Here is the first tale that resulted from that endeavour (Tinius & Russell 2014).

The Hi-Tech World of Anole Paleontology

Previously, I reviewed what we currently know about anole fossils – these fossils are preserved in amber, a fossilised tree sap/resin from Mexico and the Dominican Republic (like the one pictured right). Today, I want to share how I have been using high resolution x-ray computed tomography, a.k.a CT scanning to look at these fossils and so peer into the past.

Background to CT scanning Amber

CT scanning involves x-raying an object from many angles, and then compiling these x-rays to reconstruct 3D models of the object (more detailed description here). CT scanning works when the object being scanned is made of different materials that each absorb x-rays differently. Think of a medical x-ray; skin absorbs far fewer x-rays than bone, so the two show up as different shades of grey on the developed x-ray.

The inclusions in amber are usually subfossils, where organic material still remains (e.g., bone).

Piecing Together The Anole Family Tree: Anole Fossils

Our knowledge of the evolution of anoles comes primarily from studying living forms and using information about how species are related (phylogenetic trees) to predict how traits such as their head shape have changed over time. Scientists often use this approach because there may be few (or no) actual fossils representing those stages in the evolutionary past. For anoles, this is no exception; the fossil history of our favourite lizards is sparsely recorded. Here I shall give you, Anole Annals readers, a brief overview of what we do know about anole ancestors and what we can learn from studying these fossils.

Fossil hunting history

In the box below I summarise the five papers that have published upon fossils of the genus Anolis.

New Reviews of Lizards In An Evolutionary Tree

More than two years post-publication, reviews of Lizards in an Evolutionary Tree continue to trickle in. The most recent appeared in Austral Ecology and Herpetological Review. See all 12 (of which we’re aware–know of others?) here.

Errors in Lizards in an Evolutionary Tree

The appearance of the paperback version of Lizards in an Evolutionary Tree has provided the opportunity to correct a major error.  In the book, Figure 15.10, which was supposed to illustrate how sexual dimorphism declines as the number of species occupying an island increases, is simply wrong. The correct version can be found here, and is included as an insert with copies of the paperback. To make things more complicated, what appears as Figure 15.10 in the book is actually the correct version of Figure 15.9.  In turn, what appears as Figure 15.9 is a slightly incorrect version of the figure.  So, to recap: ignore Figure 15.9, Figure 15.10 is really Figure 15.9, and the real Figure 15.10 is on a piece of paper tucked into the front of the book, as well as posted here.

Lizards in an Evolutionary Tree Now Available in Paperback!

Get ‘em while supplies last!  Don’t miss another second of this page-turning thriller! If you order from Amazon, shipping’s free. 

Undecided?  Check out the reviews here.

E-Book Readers Beware

Not in a Digital World! (photo from http://www.livingwisdomschoolseattle.org/pages/kindergarten.html)

Lizards in an Evolutionary Tree can be bought as an e-book from its publisher, the University of California Press.  Naively, I would have thought that a virtual book would be substantially cheaper than its ink and paper counterpart, but not so; UCP charges nearly as much for the e-book as for the hardback.  The e-book does have some advantages, though: it weighs less and can be easily searched for keywords, for example.  There are disadvantages, too: you’re not supposed to make copies, or even lend it to someone else.  Further, according to infibeam.com, which sells the e-book, you’re not even allowed to read it out loud!  So, if you’re planning to host a LIAET party for Christmas, or would like to use it for nighttime stories for the kids, or even were hoping to quote from it for dramatic moments in your classroom lectures, you’d better not go digital.  Incidentally, the paperback version is due out in February, and Amazon is currently selling it for 1/3 off.

Powered by WordPress & Theme by Anders Norén