In his classic work on biogeography, Darlington (Zoogeography: The geographic distribution of animals, John Wiley, New York, 1957) used a small sample of Caribbean island herpetofaunas to show that larger islands have more species. Recently, Gao and Perry reevaluated the regional biogeographical patterns of West Indian native and nonnative herpetofauna by assessing multiple species–area relationship (SAR) models, C– and Z-values (typically interpreted to represent insularity or dispersal ability), and the contribution of area effects towards explaining among-island heterogeneity.
But this time, their sample included over 1600 islands.
They found that SARs were best modeled using the Cumulative Weibull and Lomolino relationships, both of which can display both convex and sigmoid curves. However, the Cumulative Weibull regressions were more likely to display sigmoid curves within the broad range of island sizes studied – from tiny rocks to major islands like Hispaniola and Cuba. These findings imply that the flexibility of Cumulative Weibull and Lomolino distributions may have been under-appreciated in the literature. Z-values for all herpetofauna in the current study were lower than those reported by Darlington, perhaps because the earlier study oversampled larger islands.
Broadly consistent with previous studies, Z-values reported by Gao and Perry were ranked: (1) native > nonnative; (2) reptiles > amphibians; (3) snake > lizard > frog > turtle > crocodilian. Area had a weaker effect on among-island heterogeneity for nonnative species than for native species, as might be expected given the different processes of species accumulation in the two groups. Lower extinction rates could contribute to low between-island heterogeneity for native species. In contrast, the arrival of non-native species is more closely related to economic activity than to island size. For most small islands less affected by human activities, extinction and dispersal limitation are the primary processes producing low species richness. High levels of among-island heterogeneity underlie the high value of this region as a biodiversity hotspot.
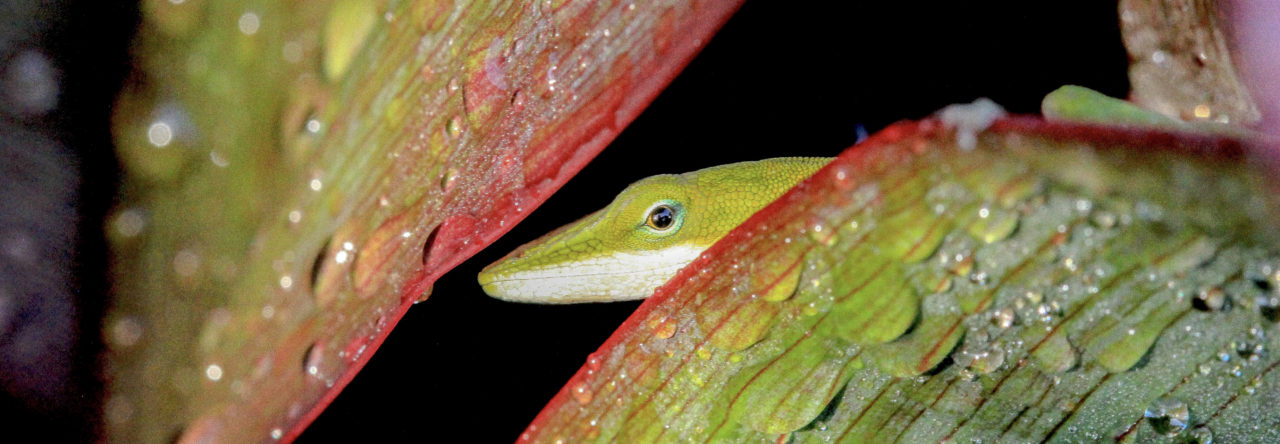
So what does this tell us about anoles? To the extent that the lizard patterns reflect the large number of Anolis species in this region, the findings imply that within-island speciation, rather immigration related to island area, is the main source of new native species in this region. Not surprisingly, perhaps, human activities accelerate the rate of over-water dispersal of both native and non-native species and weaken the area effect within the region. This leads to increases in among-island heterogeneity under human-mediated conditions. Anoles may be more likely to be affected by the increase in extinction rates that is typically seen on the smallest islands.


Leave a Reply