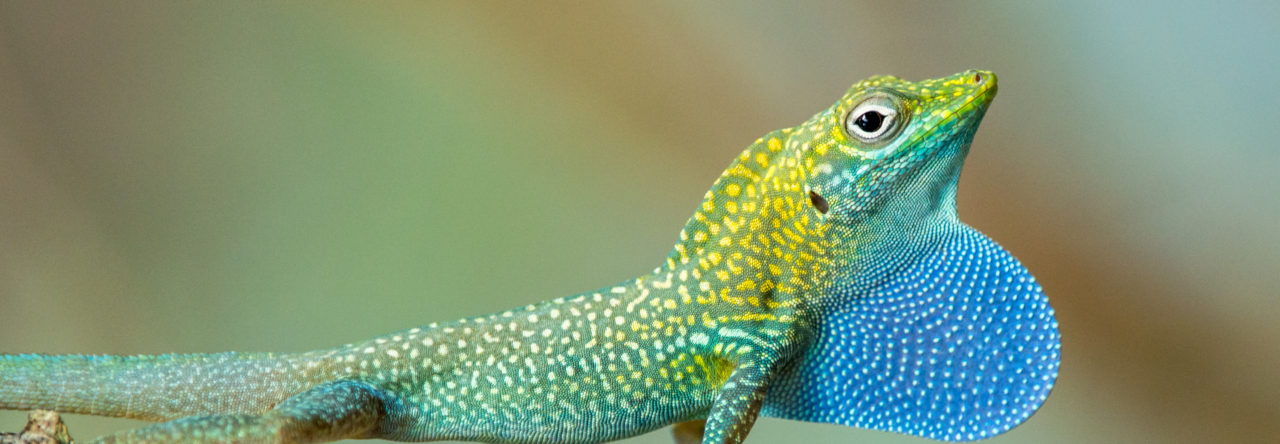

Anolis carolinensis from North Carolina. Photo from Carolina Nature.
One of the most well-known species of anole lizard is Anolis carolinensis, AKA the green anole, which is the only anole native to the continental United States. As a classic model for ecology and behavior, this lizard was the first species of reptile to have a complete genome sequence. Interestingly, only after it became a genomic model, numerous studies (Tollis et al. 2012, Campbell-Staton et al. 2012, Tollis & Boissinot 2014) sought to understand how genetic variation is structured across the geographic range of A. carolinensis, and to infer historical migration patterns and demographic events to explain the current distribution of green anoles. However, these studies still left many questions unanswered, mostly due to the fact that they were limited in terms of numbers of genetic markers. Now, we have published a new paper in Ecology and Evolution that used a targeted enrichment method to capture more than 500 sequence markers and provide a clearer picture of A. carolinensis historical biogeography.
What we knew about Anolis carolinensis phylogeography
Collecting green anoles for phylogeographic study has been a real hoot, taking us all over the country. Anolis carolinensis ranges across subtropical North America, and consists of five geographically structured genetic clusters supported by both mitochondrial (mtDNA; see Tollis et al. 2012 and Campbell-Staton et al. 2012) and nuclear (nDNA) markers (see Tollis et al. 2012, Tollis & Boissinot 2014). Three of the clusters are found in Florida : one whose distribution primarily hugs the Northwestern coast of the peninsula, another along the Eastern coast of the peninsula, and a third relegated to South Florida. The continental mainland, while making up most of the area of green anole range, harbors only two clusters: one occupying North Carolina and South Carolina, and another from Georgia, west of the Appalachian Mountains and across the Gulf Coastal Plain into Texas.
One confusing result from earlier studies of A. carolinensis molecular phylogeography was the placement of the most basal lineage in NW Florida (Tollis et al. 2012, Campbell-Staton et al. 2012). This didn’t make sense biogeographically, since it is believed that the species dispersed to the continental mainland from western Cuba (Buth et al. 1980, Glor et al. 2005). However, a subsequent nDNA study (Tollis & Boissinot 2014) produced a multi-locus species tree to show that southern Florida harbors the most ancient lineage of A. carolinensis. This discovery of mito-nuclear discordance provided a more satisfying biogeographical explanation that only needs to invoke overwater dispersal to South Florida from Cuba.

Different genetic datasets tell different stories about Anolis carolinensis evolutionary history. (A) Phylogenetic relationships of the major green anole lineages inferred from the ND2 mtDNA locus. (B) Phylogenetic relationships of the major green anole lineages using multi-locus species tree approach (1 mtDNA and 3 nDNA markers). Adapted from Manthey et al. 2016.
From there, things remained unresolved even with nDNA. For instance, while the split between South Florida and the rest of the species received full statistical support in Tollis & Boissinot (2014), the relationships between the other clades were less supported, making it difficult to determine if the A. carolinensis mainland clades arose from separate Floridian sources.
The data used in Manthey et al. 2016
To our knowledge, this is the first Anolis phylogeography study to use targeted enrichment, so I thought I would elaborate on the nature of this kind of dataset. Anchored hybrid enrichment (AHE) relies on probes designed from conserved genomic regions ascertained from a panel of vertebrate genomes – including A. carolinensis – which are flanked by non-conserved regions (the level of conservation in determined by PhastCons scores from the UCSC Genome Browser). DNA samples are pooled, and a set containing thousands of probes is used to enrich libraries that get sequenced on an Illumina platform and assembled into contigs, producing hundreds of homologous loci.
Here’s the breakdown of what we ended up with in the new study: our sample contained 42 individual anoles from 26 localities across eight states, and we were able to obtain 487-512 loci per individual, with an average contig length of 629bp, and an average of 17 SNPs per locus including an average of six parsimony-informative SNPS per locus. Roughly speaking, that’s one parsimony-informative SNP every 100bp for 500 loci, so about 3,000 parsimony-informative SNPS = not bad! For what it’s worth, the 10 nDNA A. carolinensis markers obtained by more traditional PCR/Sanger sequencing contained about one SNP every 100bp as well (see Tollis et al. 2012 and Tollis & Boissinot 2014). Therefore, AHE produced hundreds more informative loci at a fraction of the cost.
New insights into Anolis carolinensis phylogeography using targeted loci
Using different statistical clustering methods (DAPC and Structure), Manthey et al. supports the same five genetic clusters as previously described. However, there is now a fully resolved species tree – arrived at using multiple methods. First, the South Florida clade is the most ancient lineage of green anoles, likely splitting off from the rest of the species during the Miocene or Pliocene. However, there is now 100% support for a sister-group relationship between the mainland clades, massively simplifying the story of A. carolinensis. Green anoles likely remained in Florida until the Pleistocene, dispersing northward and onto the mainland where two lineages evolved independently- one along the Atlantic coast in the Carolinas, and another dispersing across the Gulf Coastal Plain.

(A) Map showing geographic localities of 42 green anoles selected for targeted enrichment. (B) Results of species tree analyses. Colored symbols correspond to the five geographic and genetic clusters. Adapted from Manthey et al. (2016).
We also found that despite the best resolution to date for the A. carolinensis species tree, incomplete lineage sorting is rampant across these loci, highlighting the need for these kinds of datasets for phylogeographic studies at this evolutionary distance. For instance, the only clade with any gene trees supporting exclusive ancestry was South Florida: meaning on a given gene tree, pre-defined “clades” are often paraphyletic. The reason the species trees agreed in their topologies is due to fact that they probabilistically invoke the coalescent process, which incorporates incomplete lineage sorting. Previous studies, using ≤10 loci, simply lacked enough statistical power to do this confidently.
More work to be done
As with most scientific endeavors, the new study resolves some outstanding questions but also begs new questions. For instance, although we were able to infer gene flow between the Gulf-Atlantic and NW Florida clades, the degree of allele sharing between populations is still not clear. There seems to be some admixture between the Gulf-Atlantic and Carolinas clades south of the Appalachian Mountains in Georgia, suggesting elevational gradients provide a more effective barrier to gene flow in this species than riverine barriers. Also, the divergence times of the green anole clades are still based only on molecular clock models and could benefit greatly from informative fossils calibrations.
I study comparative genomics of reptiles, birds, and mammals to understand substitution rate variation across lineages, the link between genotypes and phenotypes, and the evolution of cancer suppression.
- Hundreds of Genes Help to Resolve Green Anole Evolutionary History in North America - October 24, 2016
- The Genetics of Anolis Lizard Tail Regeneration: (Re)generating Major Internet Buzz - August 29, 2014
- Green Anoles, Genomic Evolution And Surfing (Wait, What?) - October 3, 2013
Skip Lazell
Cool! But no sample from Mississippi? Want some? I’ve had a yard full all my life!
Skip