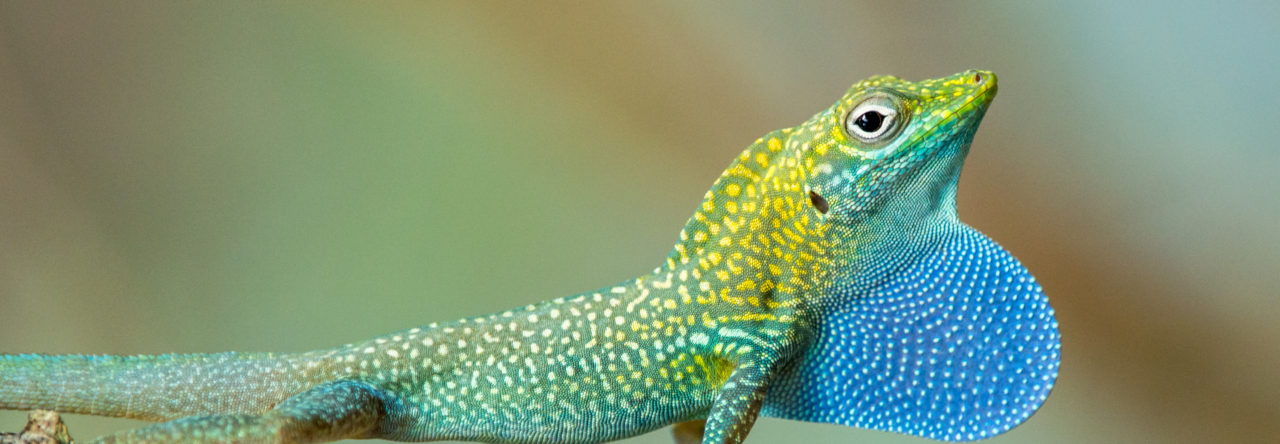

Evolution of species in a two-dimensional morphospace. Axes are from a principal components analysis of morphology; symbols represent different ecomorph classes.
Over on the Phytools blog, anole biologist and comparative methods guru Liam Revell provides a program to visualize the evolution of traits in multivariate space, termed a “phylomorphospace.” This method plots species’ values and connects the points to portray their phylogenetic relationships. Most imporantly, the example he uses is none other than Greater Antillean anole ecomorphs, using a figure developed by Luke Mahler and pictured above. The diagram above illustrates convergence of the ecomorphs by showing that members of the same ecomorph class occur in the same parts of morphological space, even though many members of each ecomorph are not closely related to each other. Each large dot represents an extant ecomorph and the color indicates ecomorph class; small dots are internal nodes of the phylogeny. Admittedly, these spaghetti-grams can be hard to follow for large phylogenies, but they do give a sense of how traits have evolved and the extent to which convergence occurs.

- New Article on Anolis roosevelti and the Question of Its Survival - March 16, 2024
- Lizard Diving Champions: Trading Heat For Safety Underwater - March 15, 2024
- Do Large Brown Anoles Get the Most Mating Opportunities? - January 6, 2024
Leave a Reply